 7
7peptides
spectra
0.000 | 0.000
0.000 | 0.065
0.046 | 0.122
0.017 | 0.154
0.180 | 0.316
0.000 | 0.000
0.517 | 0.547
0.000 | 0.000
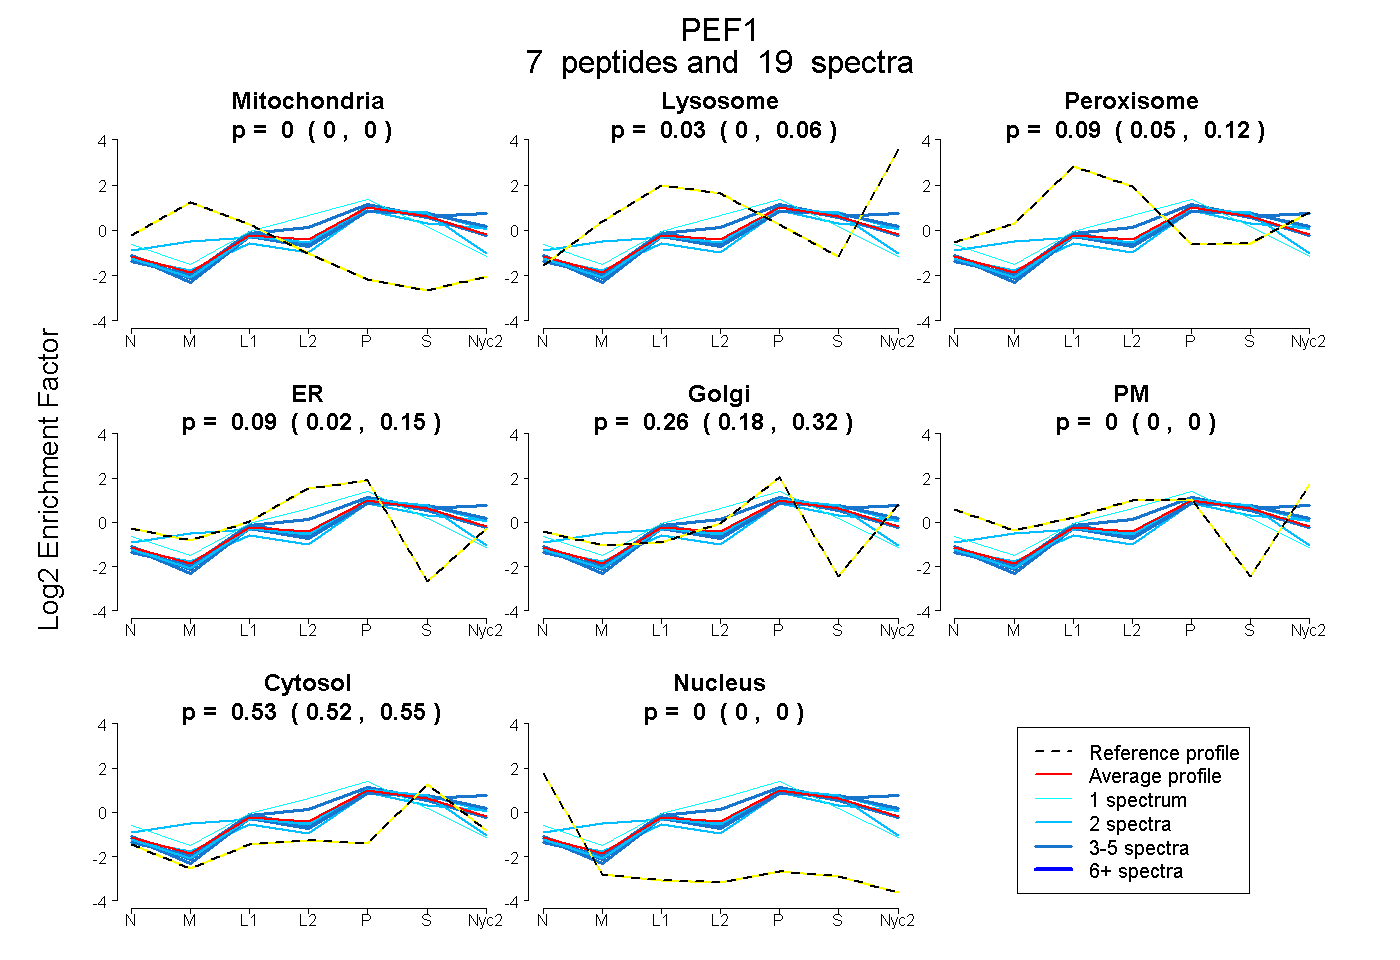
| Plot | Mito | Lyso | Perox | ER | Golgi | PM | Cytosol | Nucleus | |||||
| Expt A |
7 peptides |
19 spectra |
|
0.000 0.000 | 0.000 |
0.029 0.000 | 0.065 |
0.092 0.046 | 0.122 |
0.088 0.017 | 0.154 |
0.258 0.180 | 0.316 |
0.000 0.000 | 0.000 |
0.533 0.517 | 0.547 |
0.000 0.000 | 0.000 |
| 2 spectra, VCTQLQVLTEAFR | 0.000 | 0.000 | 0.000 | 0.355 | 0.000 | 0.000 | 0.645 | 0.000 | ||
| 4 spectra, NLFQQYDR | 0.000 | 0.117 | 0.000 | 0.000 | 0.287 | 0.000 | 0.596 | 0.000 | ||
| 2 spectra, DTAVQGNIR | 0.000 | 0.037 | 0.177 | 0.000 | 0.378 | 0.000 | 0.407 | 0.000 | ||
| 1 spectrum, SAIPAMQLDCFIK | 0.000 | 0.000 | 0.057 | 0.525 | 0.000 | 0.000 | 0.418 | 0.000 | ||
| 4 spectra, FLQQWK | 0.000 | 0.229 | 0.000 | 0.074 | 0.218 | 0.000 | 0.480 | 0.000 | ||
| 4 spectra, LSFEDFVTMTASR | 0.000 | 0.003 | 0.126 | 0.014 | 0.329 | 0.000 | 0.528 | 0.000 | ||
| 2 spectra, IDVVGFSALWK | 0.000 | 0.087 | 0.000 | 0.000 | 0.311 | 0.000 | 0.602 | 0.000 |
| Plot | Mito | Lyso or Perox | ER | Golgi | PM | Cytosol | Nucleus | ||||||
| Expt B |
4 peptides |
5 spectra |
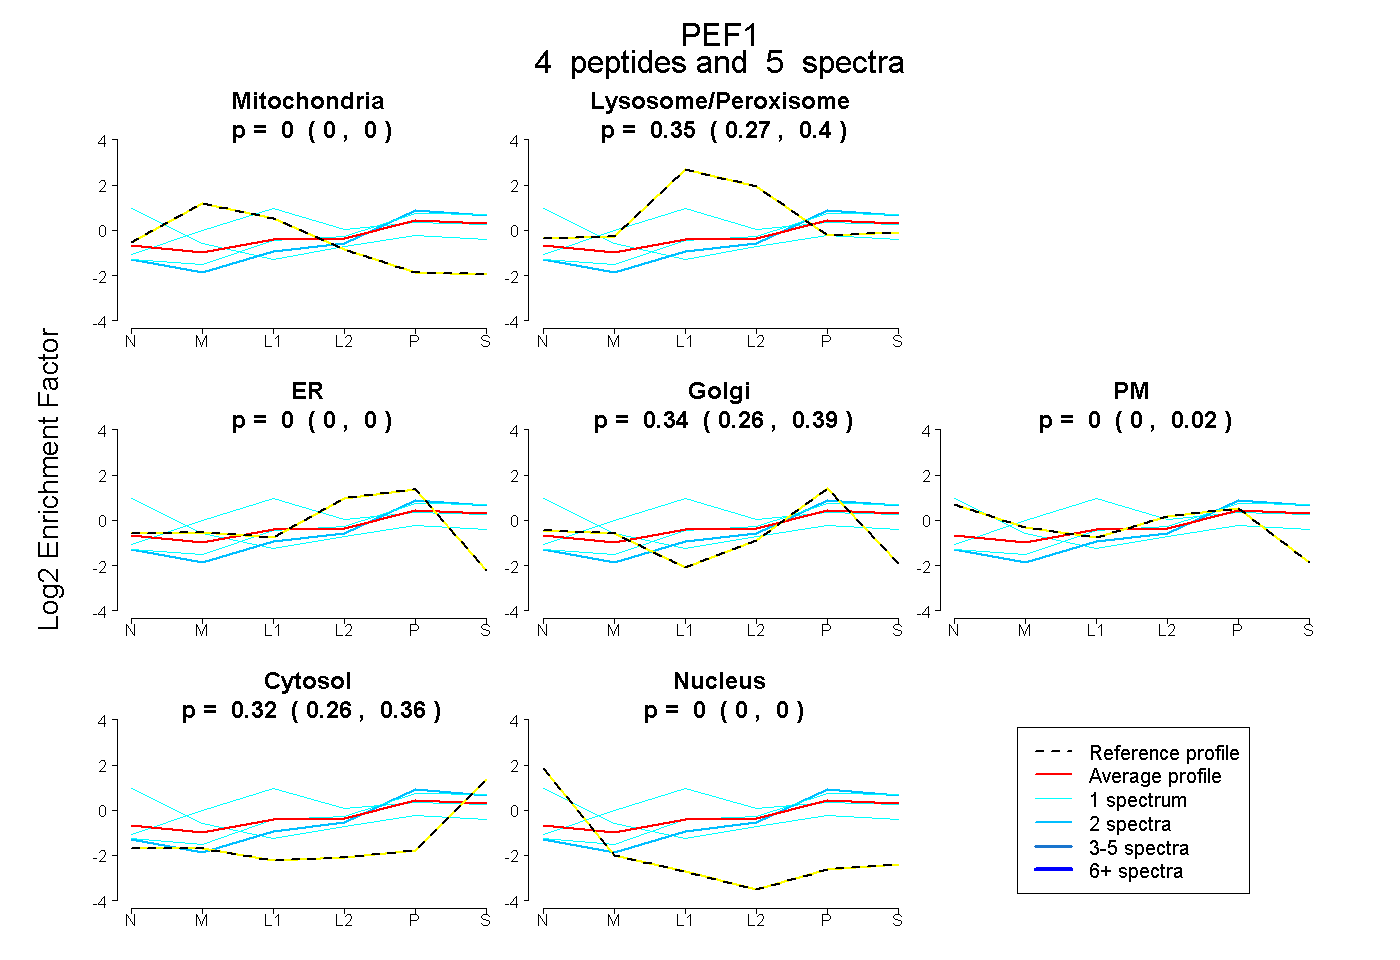 |
0.000 0.000 | 0.000 |
0.346 0.275 | 0.399 |
0.000 0.000 | 0.000 |
0.337 0.259 | 0.392 |
0.000 0.000 | 0.015 |
0.317 0.263 | 0.360 |
0.000 0.000 | 0.000 |
|||
| Plot | Lyso | Other | |||||||||||
| Expt C |
4 peptides |
10 spectra |
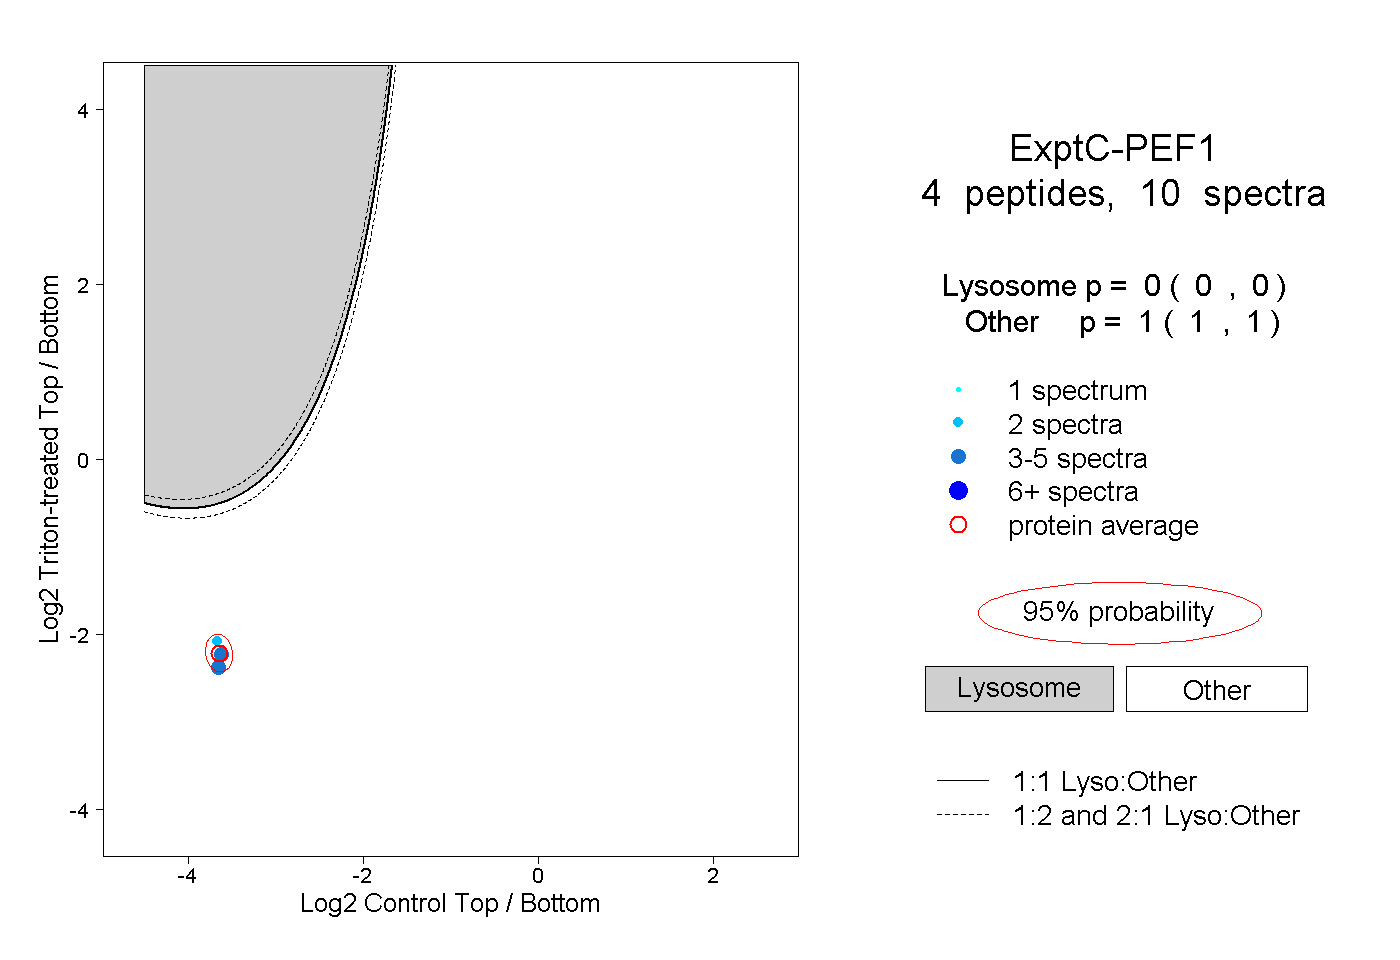 |
0.000 0.000 | 0.000 |
1.000 1.000 | 1.000 |
||||||||
| Plot | Lyso | Other | |||||||||||
| Expt D |
2 peptides |
3 spectra |
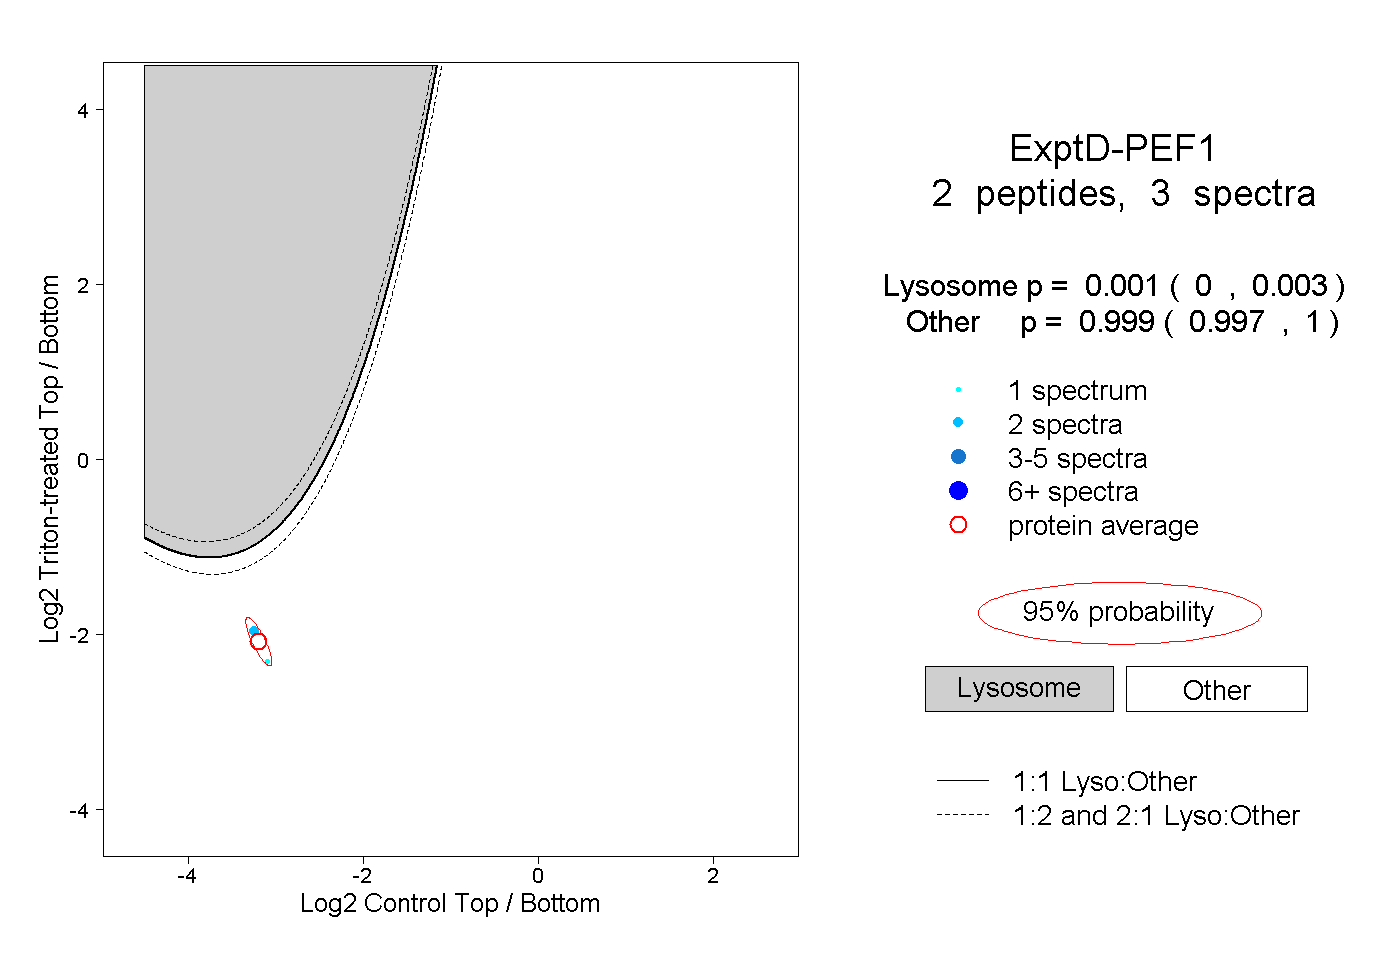 |
0.001 0.000 | 0.003 |
0.999 0.997 | 1.000 |