 20
20peptides
spectra
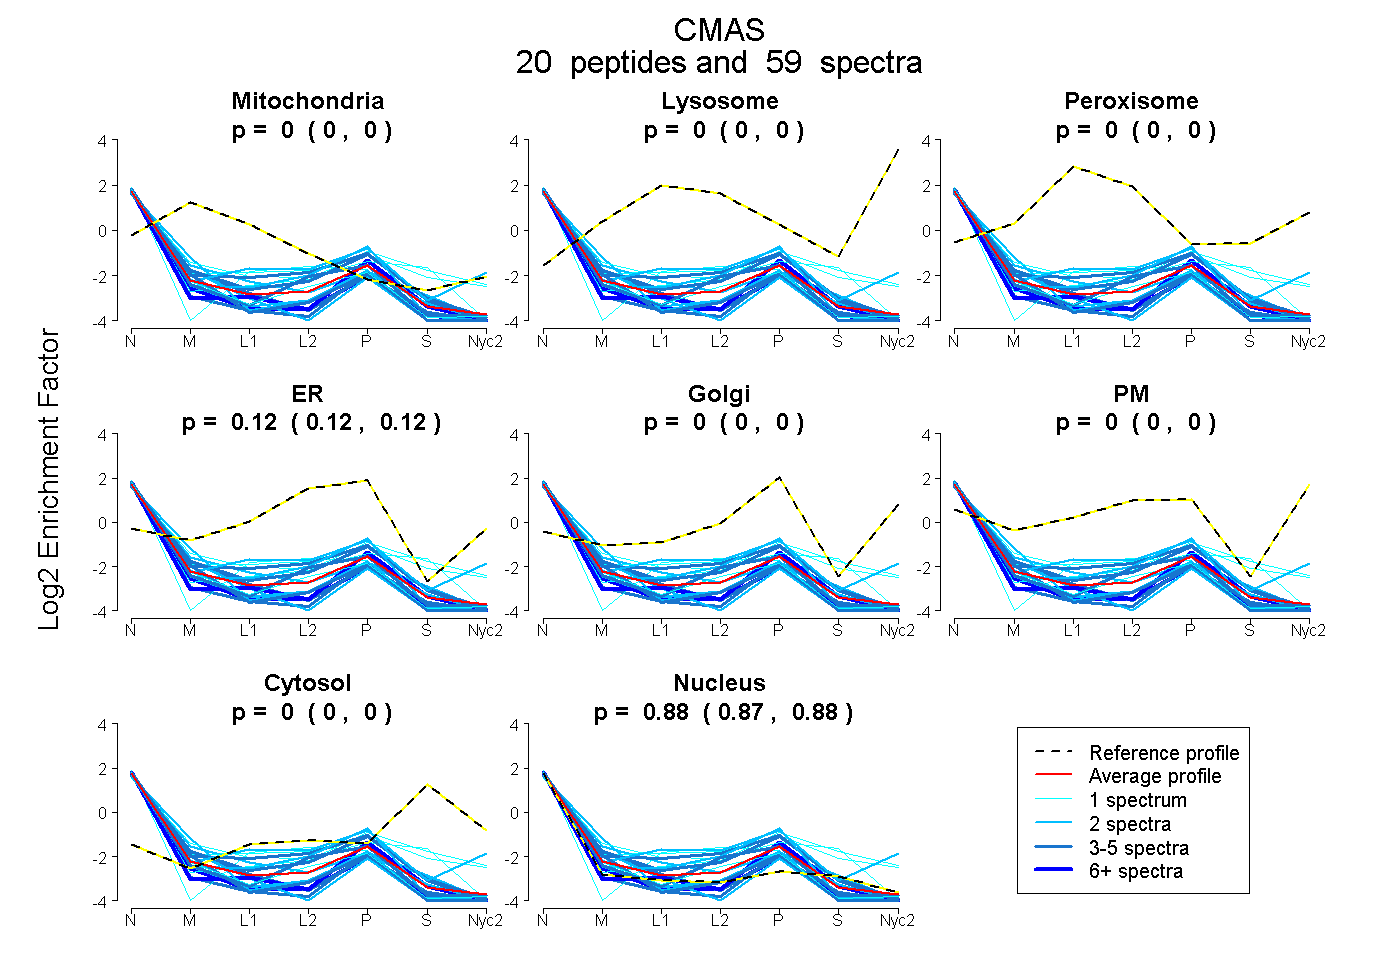
0.000 | 0.000
0.000 | 0.000
0.000 | 0.000
0.117 | 0.124
0.000 | 0.000
0.000 | 0.000
0.000 | 0.000
0.875 | 0.882
8peptides
spectra
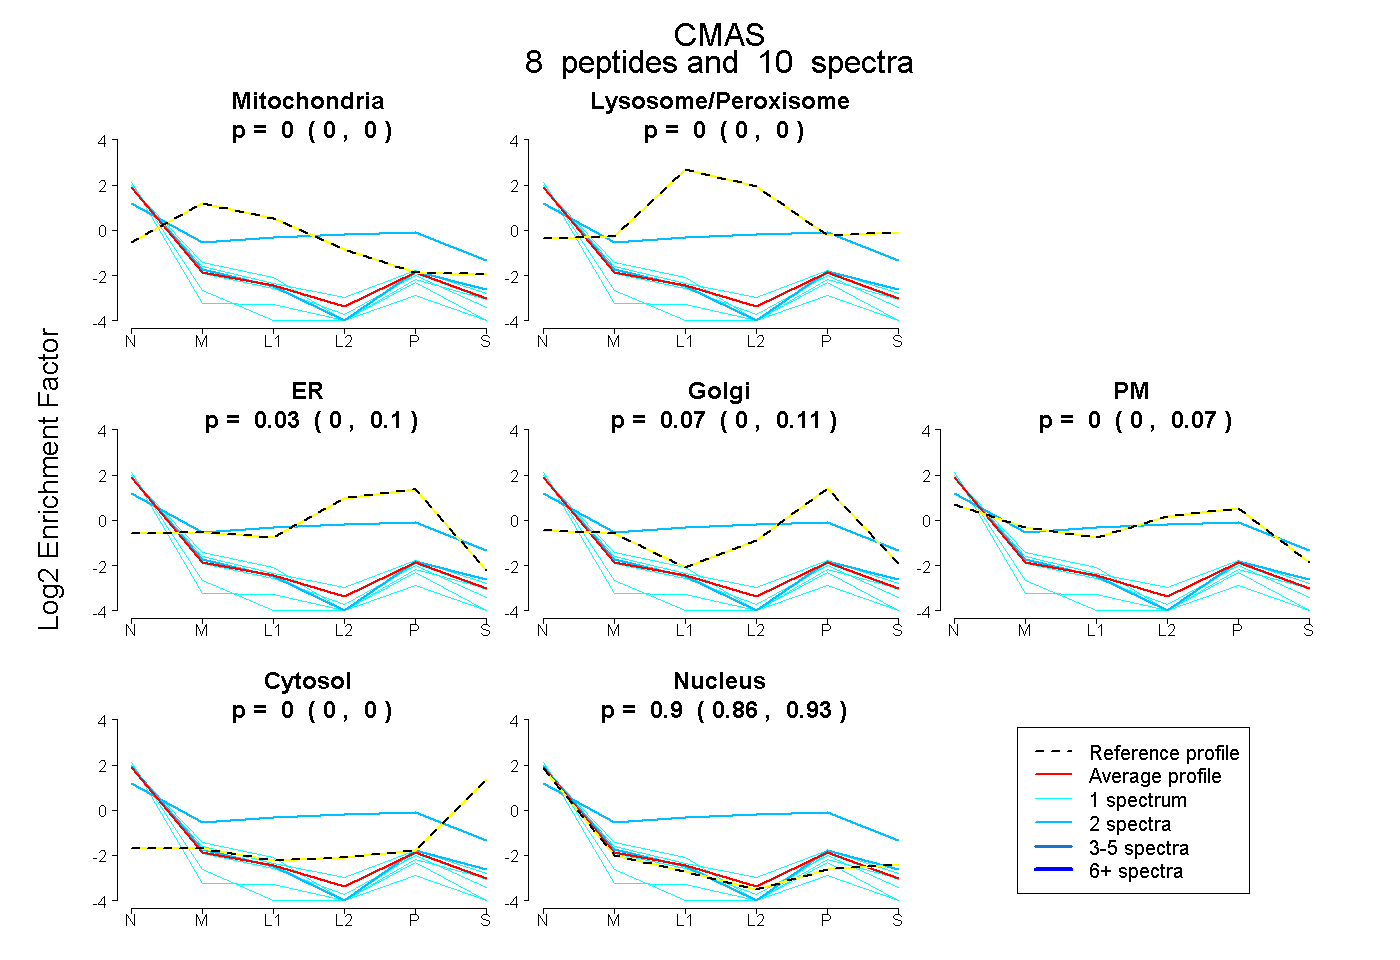
0.000 | 0.000
0.000 | 0.000
0.000 | 0.096
0.000 | 0.114
0.000 | 0.071
0.000 | 0.000
0.859 | 0.926
10peptides
spectra
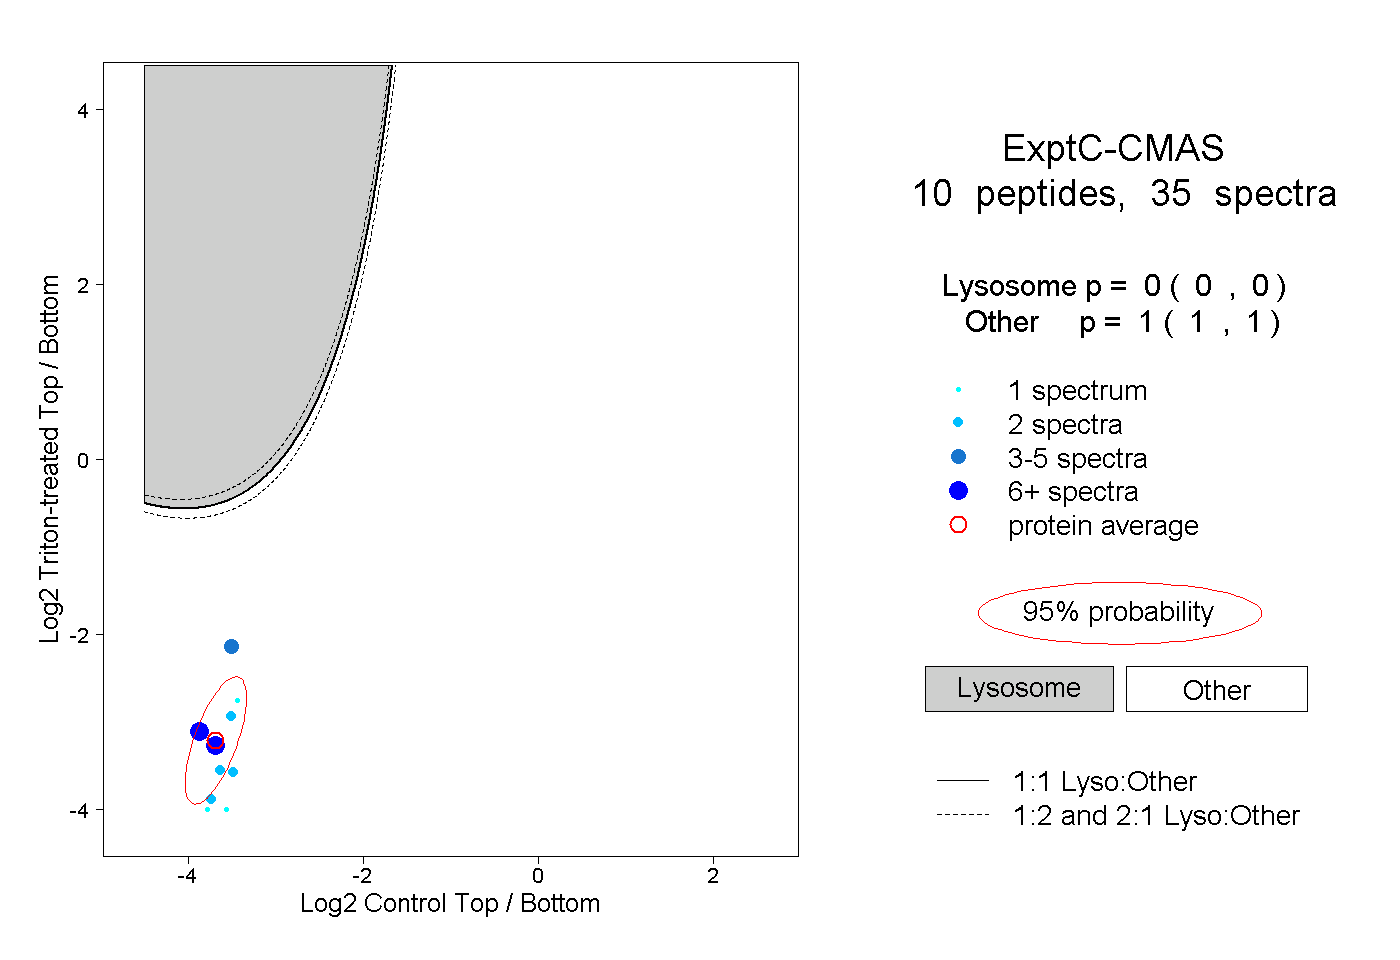
0.000 | 0.000
1.000 | 1.000
4peptides
spectra
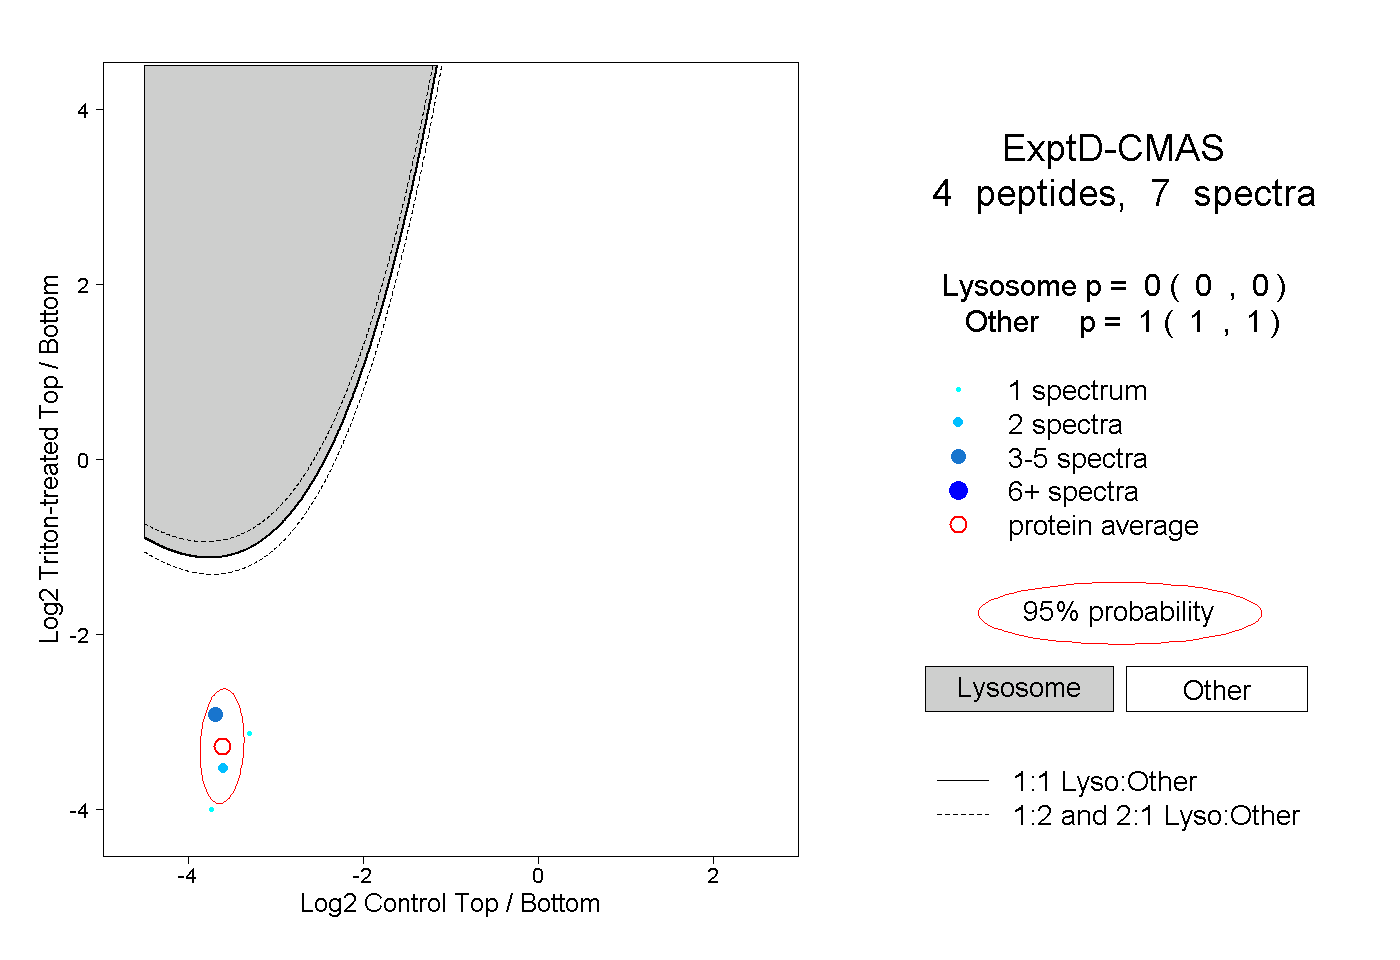
0.000 | 0.000
1.000 | 1.000