 20
20peptides
spectra
0.000 | 0.000
0.000 | 0.000
0.000 | 0.000
0.117 | 0.124
0.000 | 0.000
0.000 | 0.000
0.000 | 0.000
0.875 | 0.882
| Plot | Mito | Lyso | Perox | ER | Golgi | PM | Cytosol | Nucleus | |||||
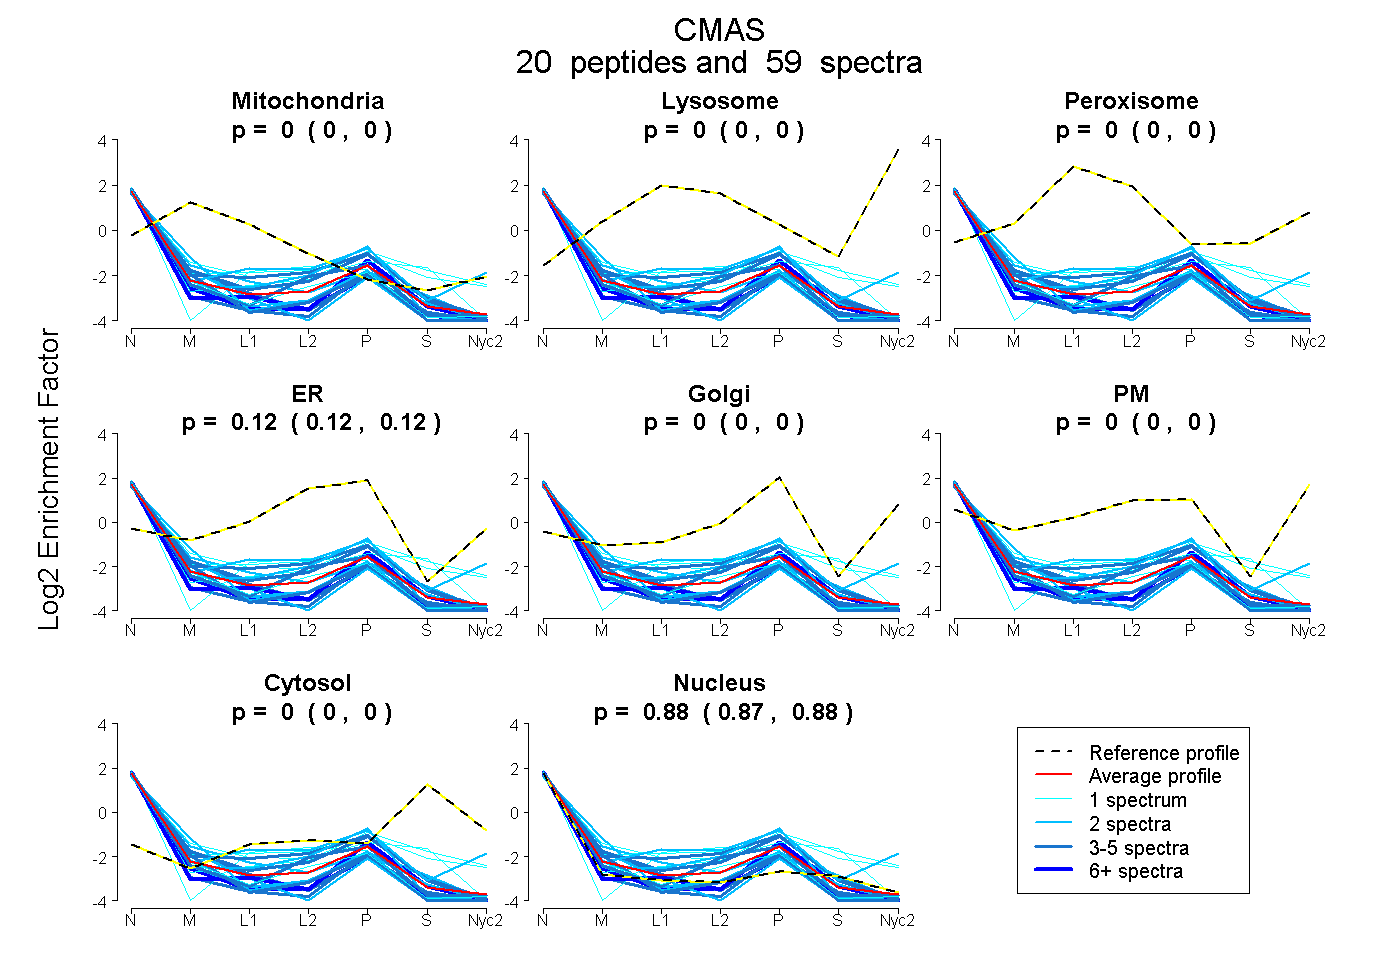
| Expt A |
20 peptides |
59 spectra |
|
0.000 0.000 | 0.000 |
0.000 0.000 | 0.000 |
0.000 0.000 | 0.000 |
0.121 0.117 | 0.124 |
0.000 0.000 | 0.000 |
0.000 0.000 | 0.000 |
0.000 0.000 | 0.000 |
0.879 0.875 | 0.882 |
| 4 spectra, EFAEHIFLLLEK | 0.000 | 0.000 | 0.000 | 0.000 | 0.000 | 0.000 | 0.000 | 1.000 | ||
| 4 spectra, TEVSVSDK | 0.007 | 0.000 | 0.000 | 0.022 | 0.000 | 0.000 | 0.000 | 0.971 | ||
| 2 spectra, SSETSK | 0.000 | 0.000 | 0.000 | 0.100 | 0.013 | 0.257 | 0.000 | 0.629 | ||
| 2 spectra, DAIGISLLK | 0.000 | 0.000 | 0.000 | 0.026 | 0.000 | 0.000 | 0.000 | 0.974 | ||
| 1 spectrum, HLIEMGYLQGGK | 0.178 | 0.000 | 0.000 | 0.090 | 0.000 | 0.000 | 0.073 | 0.659 | ||
| 2 spectra, FGYFGK | 0.052 | 0.000 | 0.000 | 0.000 | 0.000 | 0.000 | 0.000 | 0.948 | ||
| 7 spectra, AGLSAVPADACSR | 0.000 | 0.000 | 0.000 | 0.000 | 0.000 | 0.000 | 0.000 | 1.000 | ||
| 1 spectrum, EMGLCWK | 0.000 | 0.000 | 0.048 | 0.170 | 0.000 | 0.087 | 0.040 | 0.655 | ||
| 2 spectra, LAIVDEWR | 0.000 | 0.000 | 0.000 | 0.042 | 0.000 | 0.000 | 0.000 | 0.958 | ||
| 1 spectrum, WSEIQK | 0.000 | 0.000 | 0.000 | 0.091 | 0.000 | 0.000 | 0.000 | 0.909 | ||
| 2 spectra, AVGYICK | 0.193 | 0.000 | 0.000 | 0.028 | 0.000 | 0.000 | 0.000 | 0.779 | ||
| 5 spectra, MAYYEMR | 0.007 | 0.000 | 0.000 | 0.234 | 0.000 | 0.000 | 0.000 | 0.760 | ||
| 2 spectra, GLEKPPHLAALVLAR | 0.132 | 0.000 | 0.000 | 0.000 | 0.000 | 0.000 | 0.000 | 0.868 | ||
| 1 spectrum, EVTEPLNLNPAK | 0.000 | 0.000 | 0.000 | 0.157 | 0.000 | 0.000 | 0.000 | 0.843 | ||
| 4 spectra, VNNSCQK | 0.000 | 0.000 | 0.000 | 0.132 | 0.000 | 0.000 | 0.000 | 0.868 | ||
| 3 spectra, EEGYDSVFSVVR | 0.108 | 0.000 | 0.000 | 0.000 | 0.000 | 0.000 | 0.000 | 0.892 | ||
| 2 spectra, QTLSALK | 0.000 | 0.000 | 0.000 | 0.212 | 0.000 | 0.000 | 0.000 | 0.788 | ||
| 8 spectra, GAATSGPAPR | 0.000 | 0.000 | 0.000 | 0.000 | 0.049 | 0.000 | 0.000 | 0.951 | ||
| 1 spectrum, EVAYLGNEVSDEECLK | 0.000 | 0.000 | 0.000 | 0.000 | 0.227 | 0.000 | 0.123 | 0.650 | ||
| 5 spectra, QFGAQVHR | 0.018 | 0.000 | 0.000 | 0.188 | 0.000 | 0.000 | 0.000 | 0.794 |
| Plot | Mito | Lyso or Perox | ER | Golgi | PM | Cytosol | Nucleus | ||||||
| Expt B |
8 peptides |
10 spectra |
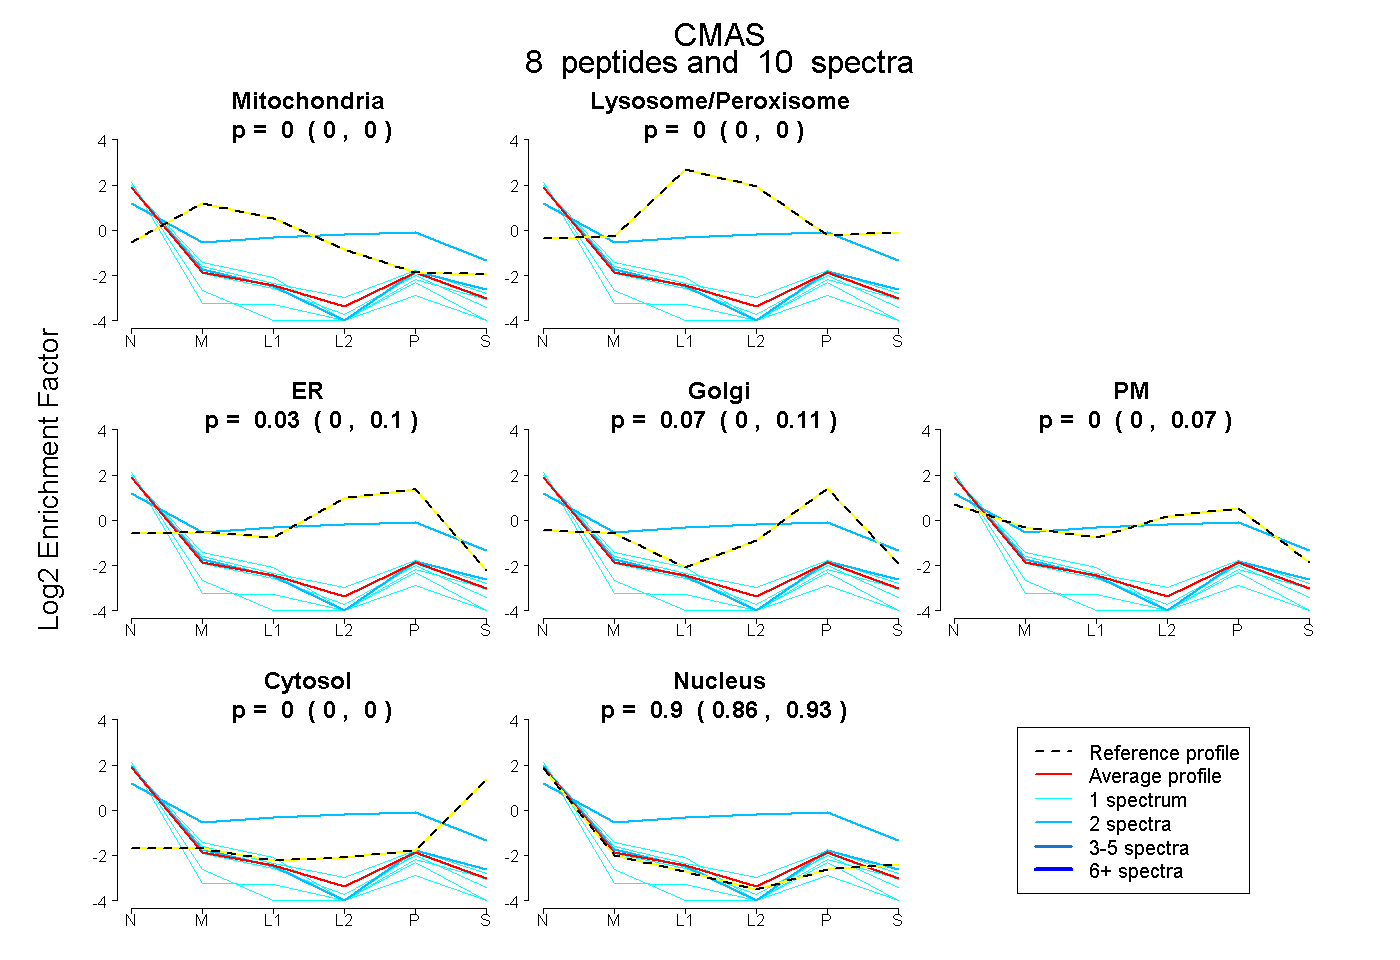 |
0.000 0.000 | 0.000 |
0.000 0.000 | 0.000 |
0.032 0.000 | 0.096 |
0.068 0.000 | 0.114 |
0.000 0.000 | 0.071 |
0.000 0.000 | 0.000 |
0.900 0.859 | 0.926 |
|||
| Plot | Lyso | Other | |||||||||||
| Expt C |
10 peptides |
35 spectra |
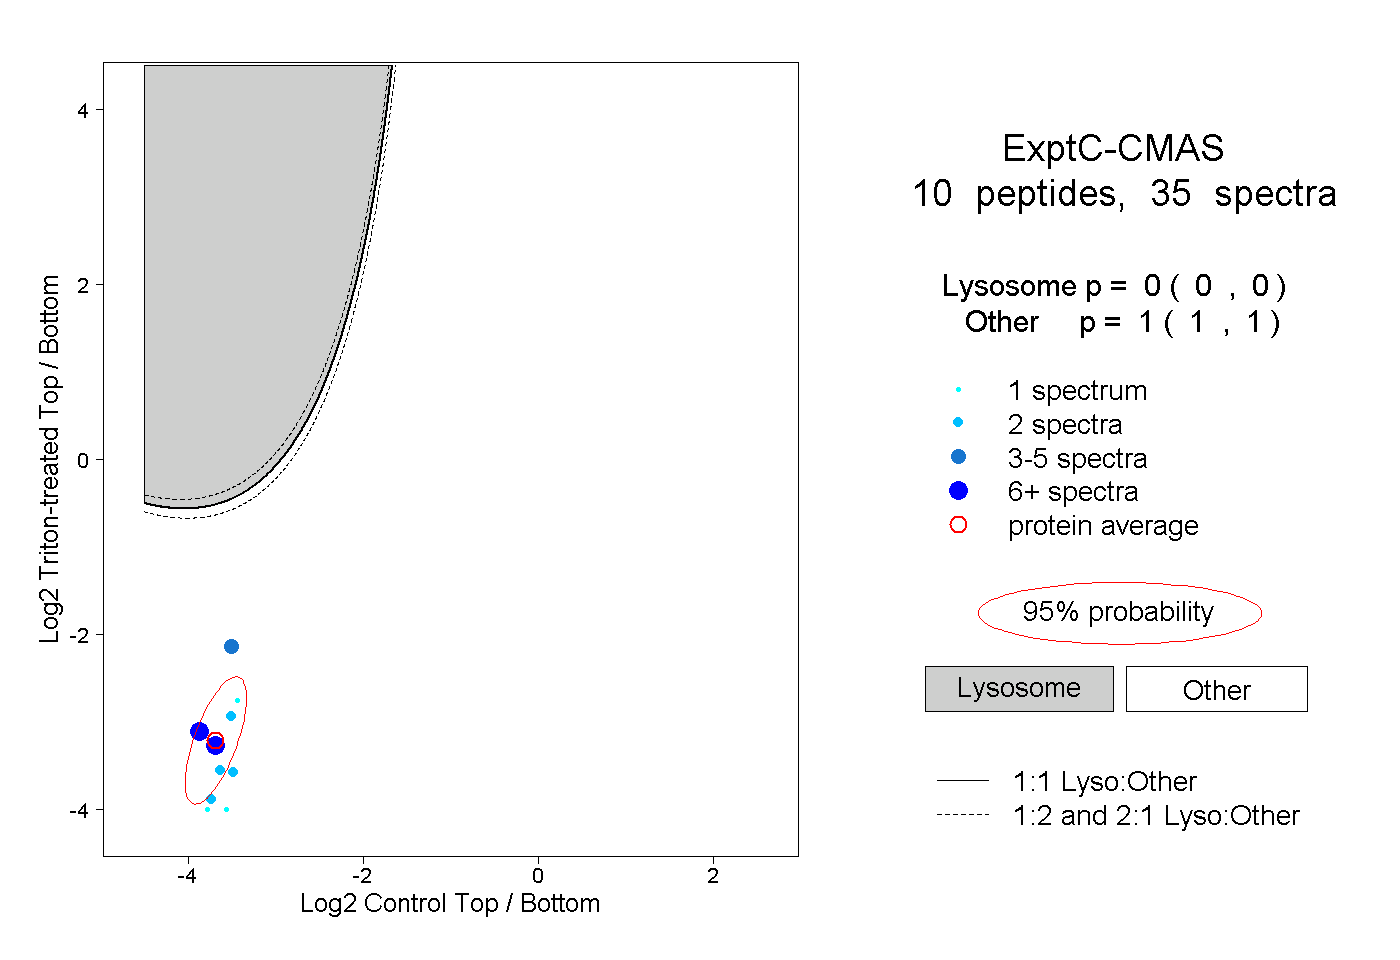 |
0.000 0.000 | 0.000 |
1.000 1.000 | 1.000 |
||||||||
| Plot | Lyso | Other | |||||||||||
| Expt D |
4 peptides |
7 spectra |
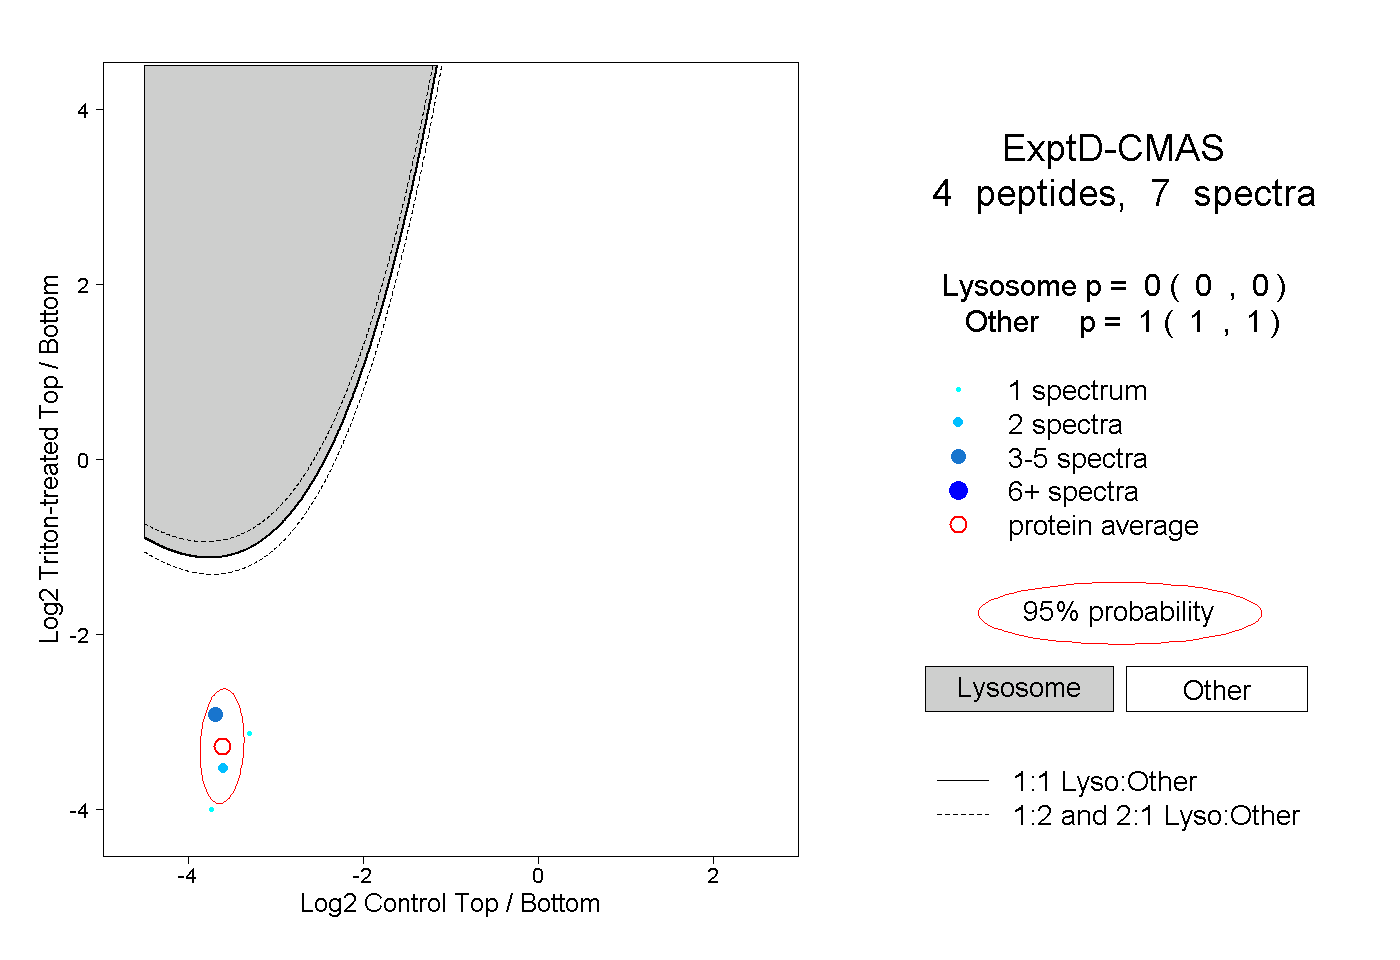 |
0.000 0.000 | 0.000 |
1.000 1.000 | 1.000 |