 10
10peptides
spectra
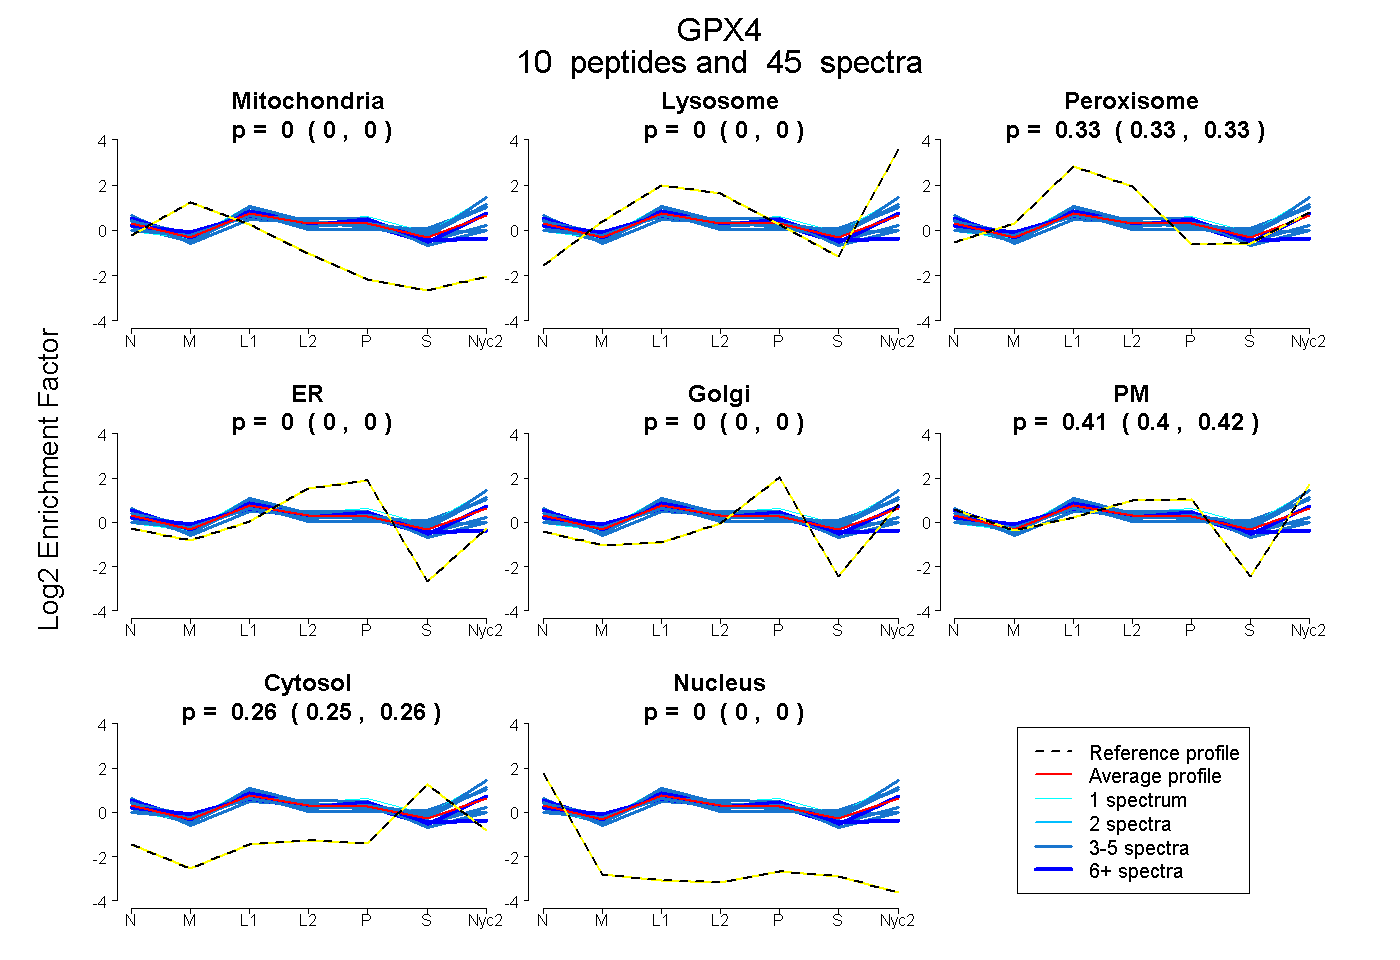
0.000 | 0.003
0.000 | 0.000
0.326 | 0.335
0.000 | 0.000
0.000 | 0.000
0.403 | 0.416
0.255 | 0.262
0.000 | 0.000
7peptides
spectra
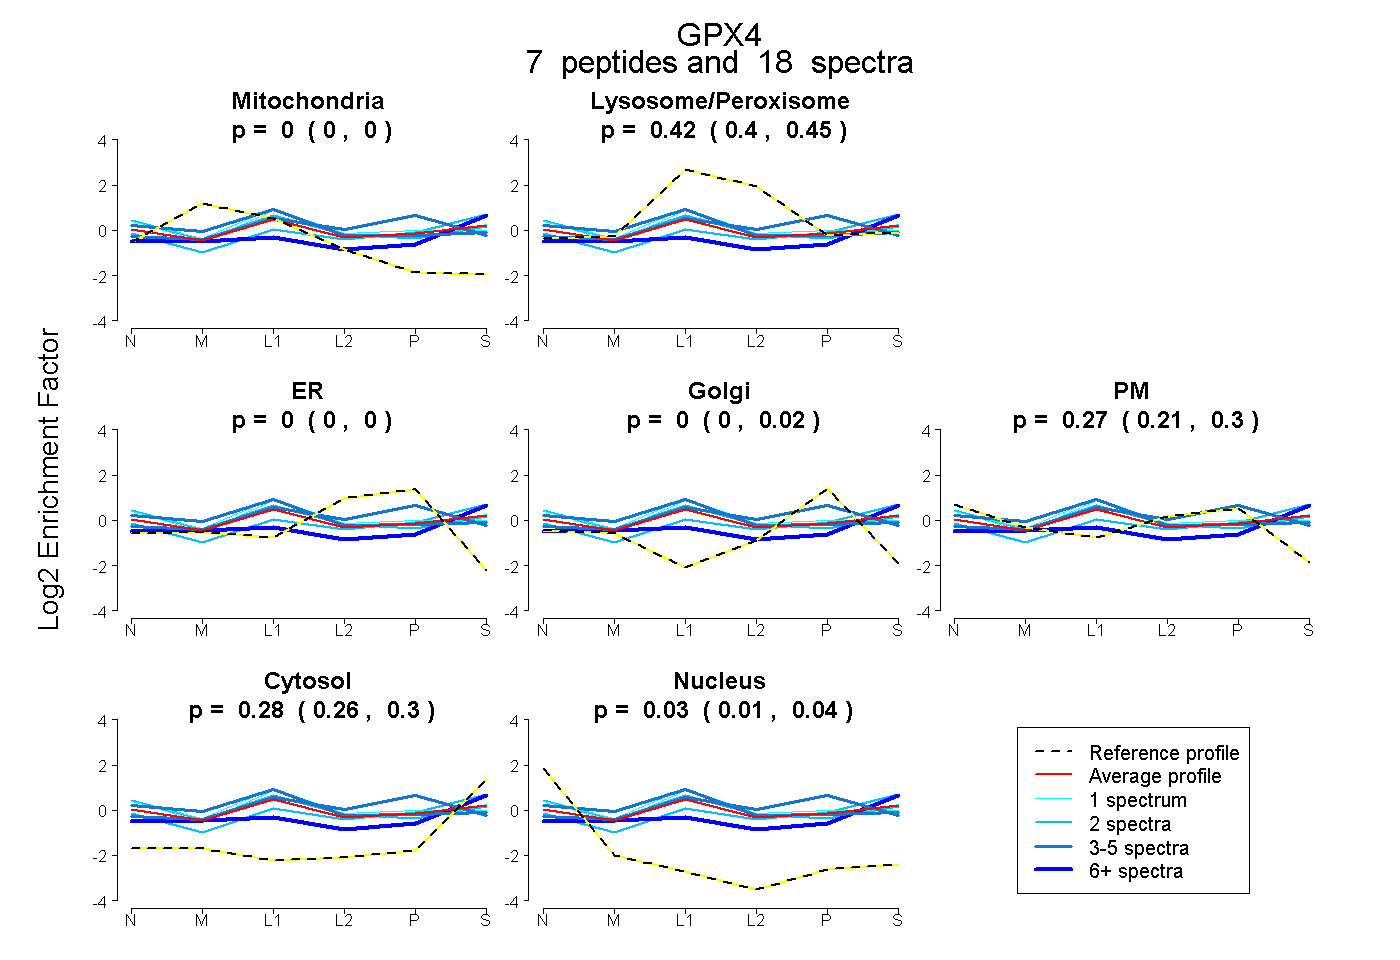
0.000 | 0.000
0.399 | 0.450
0.000 | 0.000
0.000 | 0.021
0.210 | 0.297
0.260 | 0.296
0.005 | 0.043
12peptides
spectra
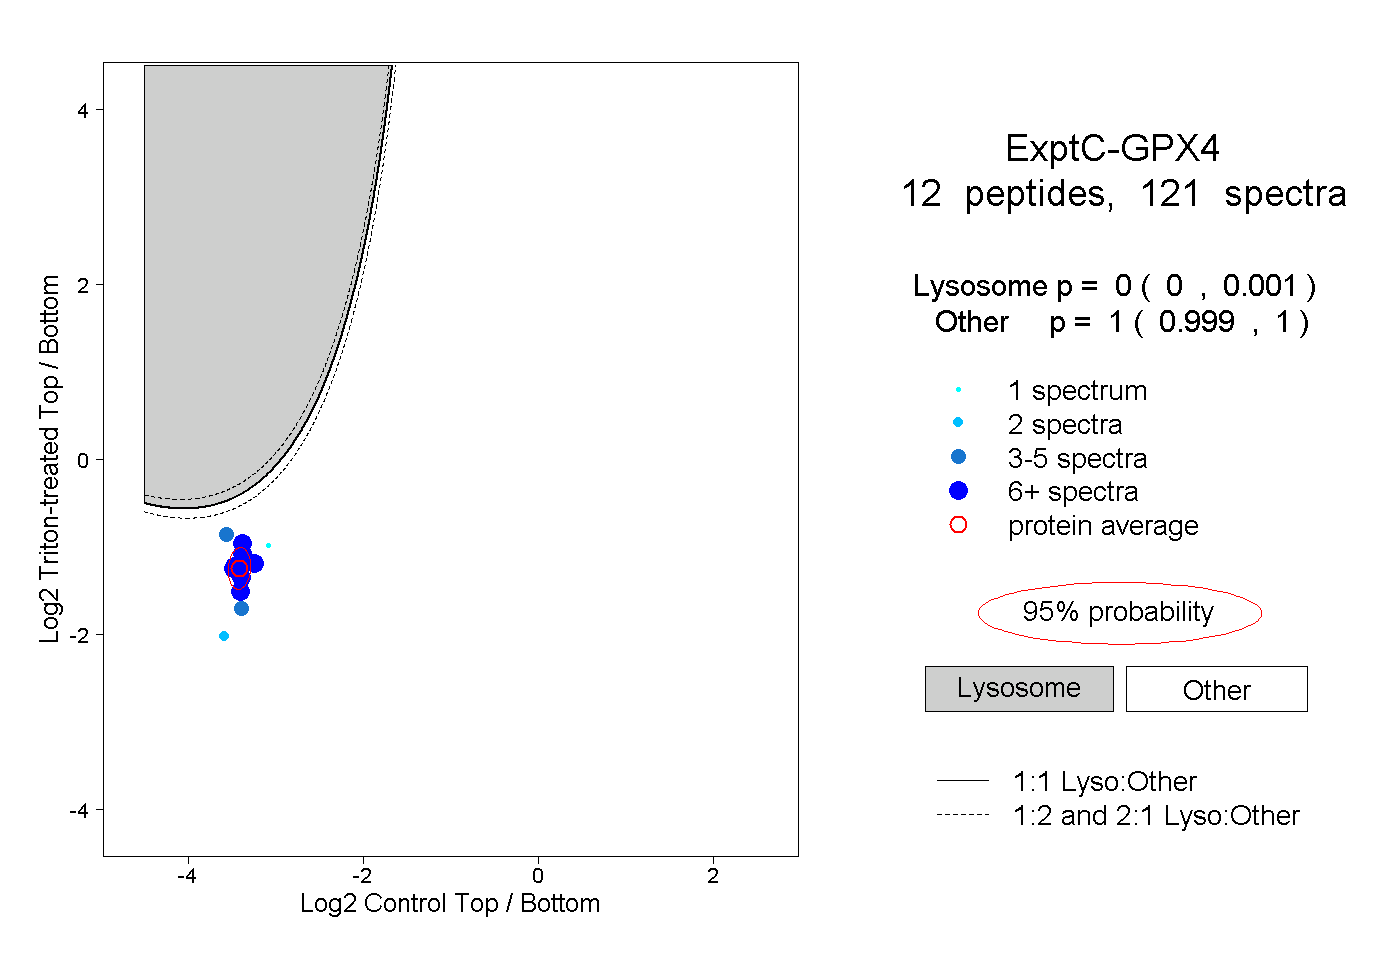
0.000 | 0.001
0.999 | 1.000
3peptides
spectra
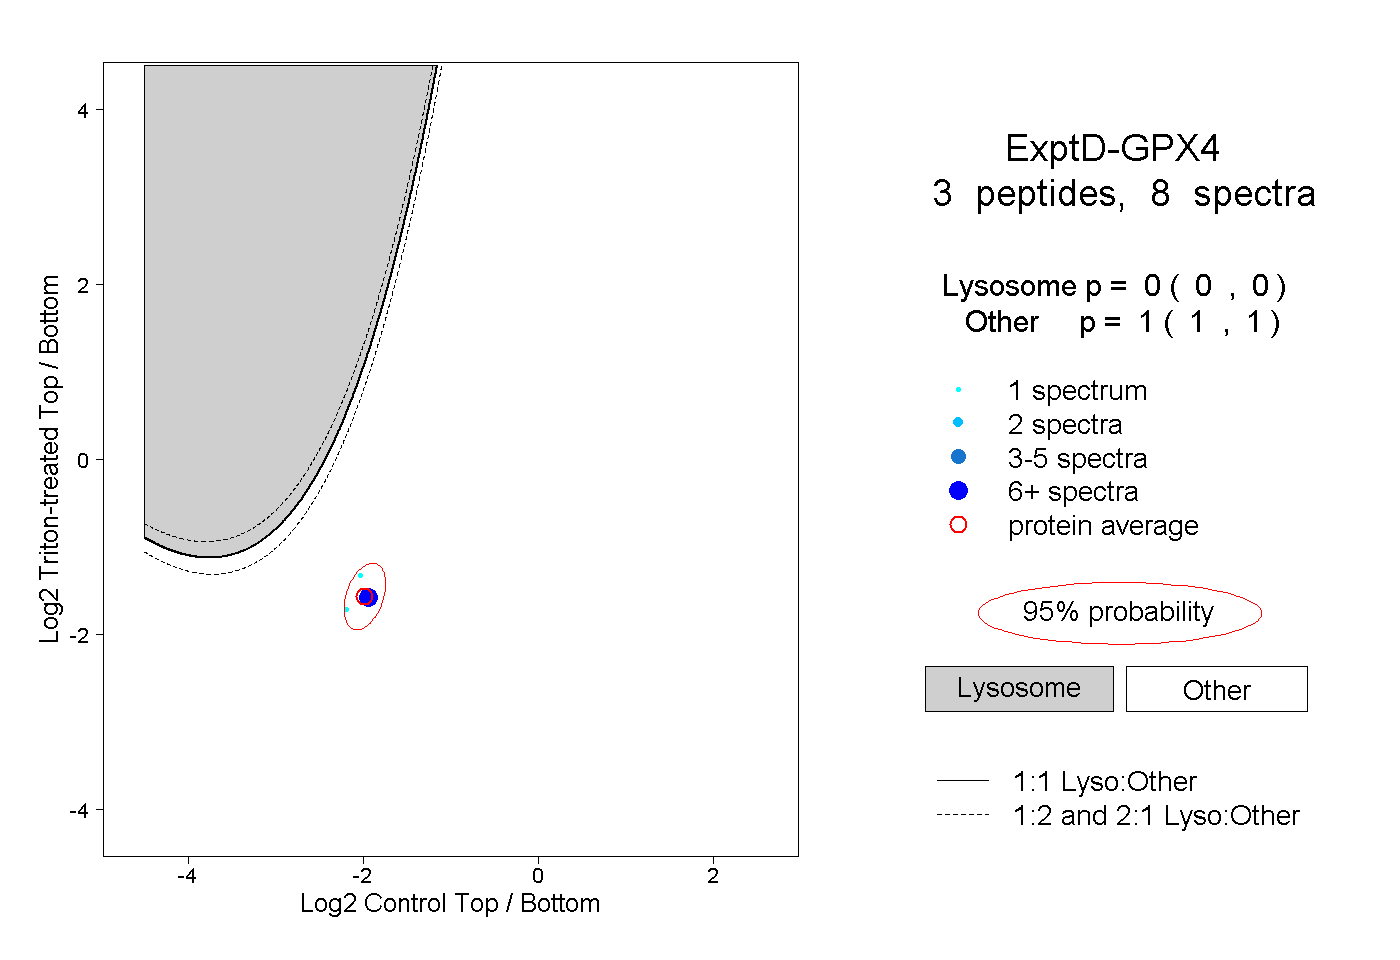
0.000 | 0.000
1.000 | 1.000