 10
10peptides
spectra
0.000 | 0.003
0.000 | 0.000
0.326 | 0.335
0.000 | 0.000
0.000 | 0.000
0.403 | 0.416
0.255 | 0.262
0.000 | 0.000
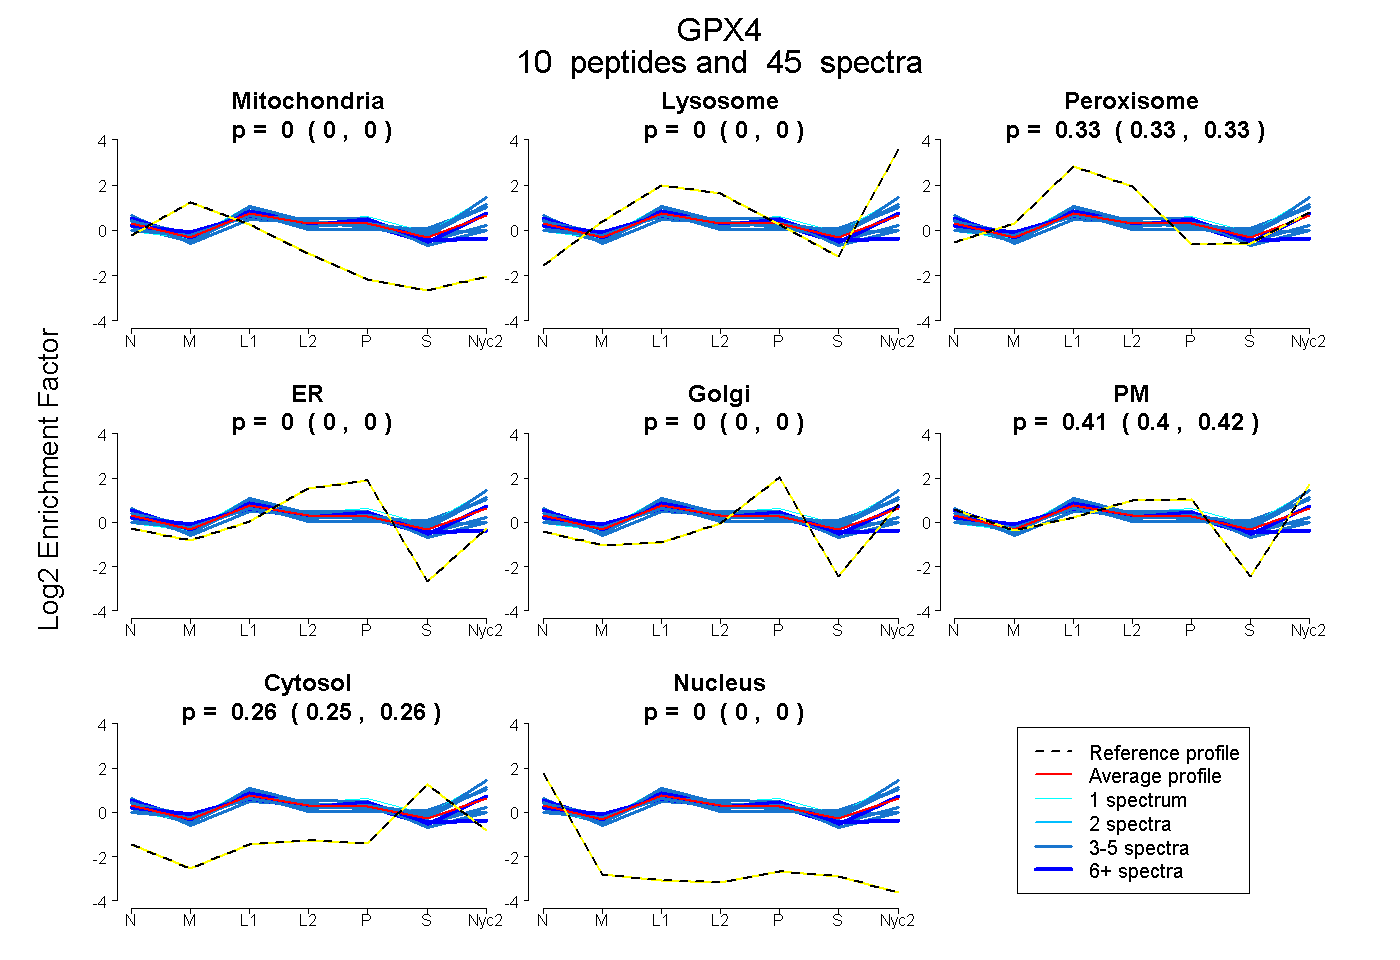
| Plot | Mito | Lyso | Perox | ER | Golgi | PM | Cytosol | Nucleus | |||||
| Expt A |
10 peptides |
45 spectra |
|
0.000 0.000 | 0.003 |
0.000 0.000 | 0.000 |
0.331 0.326 | 0.335 |
0.000 0.000 | 0.000 |
0.000 0.000 | 0.000 |
0.410 0.403 | 0.416 |
0.259 0.255 | 0.262 |
0.000 0.000 | 0.000 |
| 5 spectra, YGPMEEPQVIEK | 0.000 | 0.096 | 0.260 | 0.000 | 0.000 | 0.351 | 0.293 | 0.000 | ||
| 3 spectra, ICVNGDDAHPLWK | 0.000 | 0.000 | 0.303 | 0.012 | 0.000 | 0.401 | 0.210 | 0.073 | ||
| 5 spectra, TDVNYTQLVDLHAR | 0.000 | 0.142 | 0.219 | 0.000 | 0.000 | 0.407 | 0.233 | 0.000 | ||
| 7 spectra, YAECGLR | 0.099 | 0.000 | 0.386 | 0.099 | 0.221 | 0.000 | 0.164 | 0.030 | ||
| 3 spectra, NGCVVK | 0.035 | 0.000 | 0.369 | 0.119 | 0.105 | 0.183 | 0.138 | 0.050 | ||
| 3 spectra, QEPGSNQEIK | 0.000 | 0.003 | 0.371 | 0.000 | 0.000 | 0.406 | 0.221 | 0.000 | ||
| 5 spectra, DIDGHMVCLDK | 0.000 | 0.000 | 0.528 | 0.000 | 0.192 | 0.030 | 0.186 | 0.064 | ||
| 1 spectrum, FDMYSK | 0.000 | 0.197 | 0.265 | 0.000 | 0.021 | 0.300 | 0.217 | 0.000 | ||
| 10 spectra, ILAFPCNQFGR | 0.000 | 0.000 | 0.339 | 0.000 | 0.000 | 0.444 | 0.191 | 0.026 | ||
| 3 spectra, EFAAGYNVR | 0.000 | 0.066 | 0.304 | 0.000 | 0.000 | 0.315 | 0.315 | 0.000 |
| Plot | Mito | Lyso or Perox | ER | Golgi | PM | Cytosol | Nucleus | ||||||
| Expt B |
7 peptides |
18 spectra |
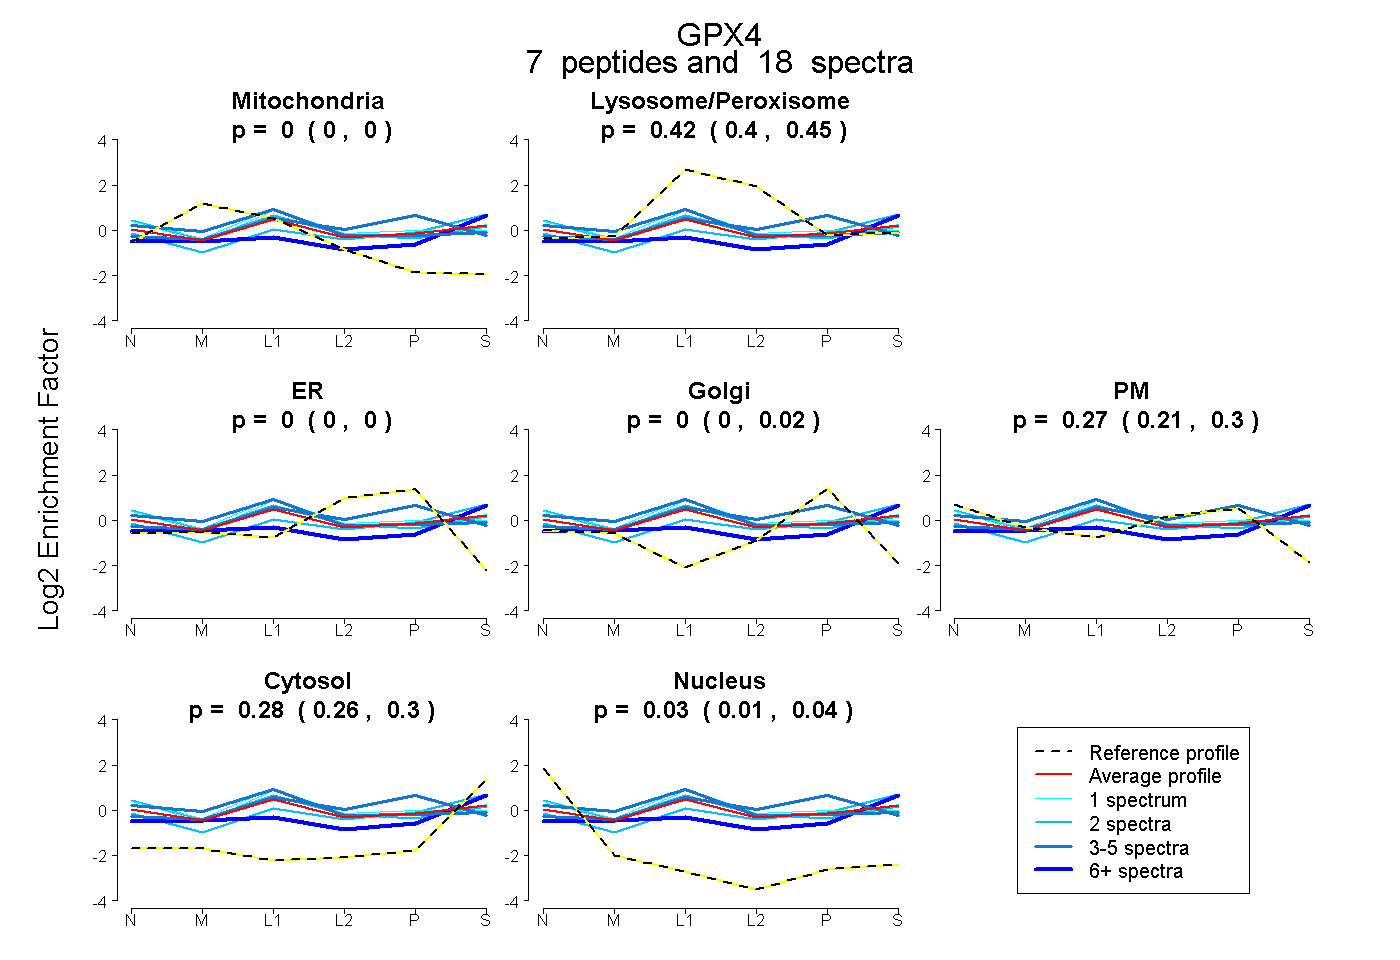 |
0.000 0.000 | 0.000 |
0.425 0.399 | 0.450 |
0.000 0.000 | 0.000 |
0.000 0.000 | 0.021 |
0.269 0.210 | 0.297 |
0.281 0.260 | 0.296 |
0.025 0.005 | 0.043 |
|||
| Plot | Lyso | Other | |||||||||||
| Expt C |
12 peptides |
121 spectra |
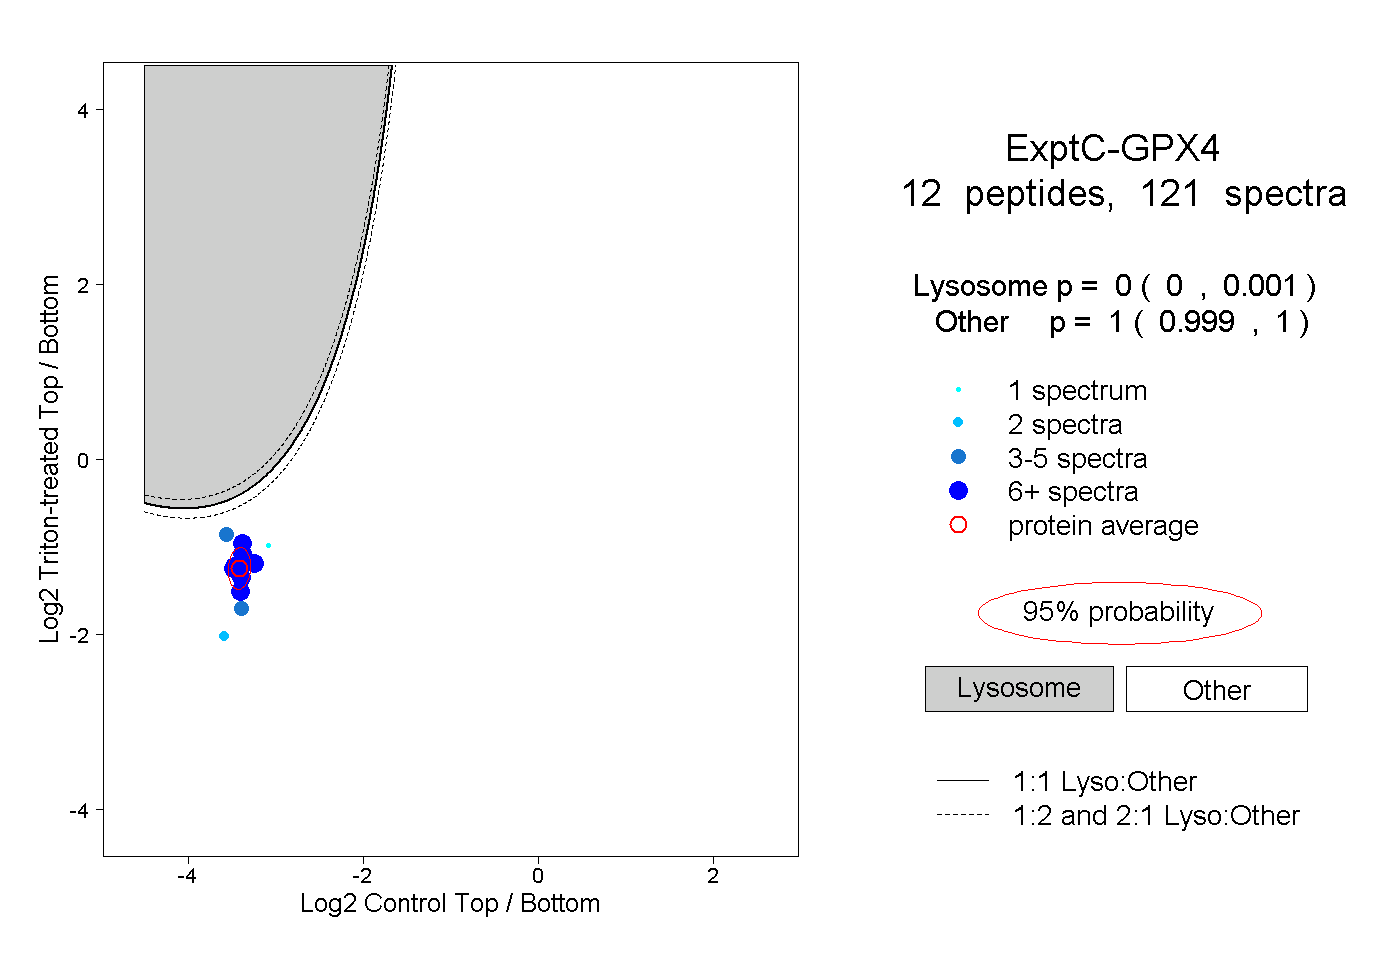 |
0.000 0.000 | 0.001 |
1.000 0.999 | 1.000 |
||||||||
| Plot | Lyso | Other | |||||||||||
| Expt D |
3 peptides |
8 spectra |
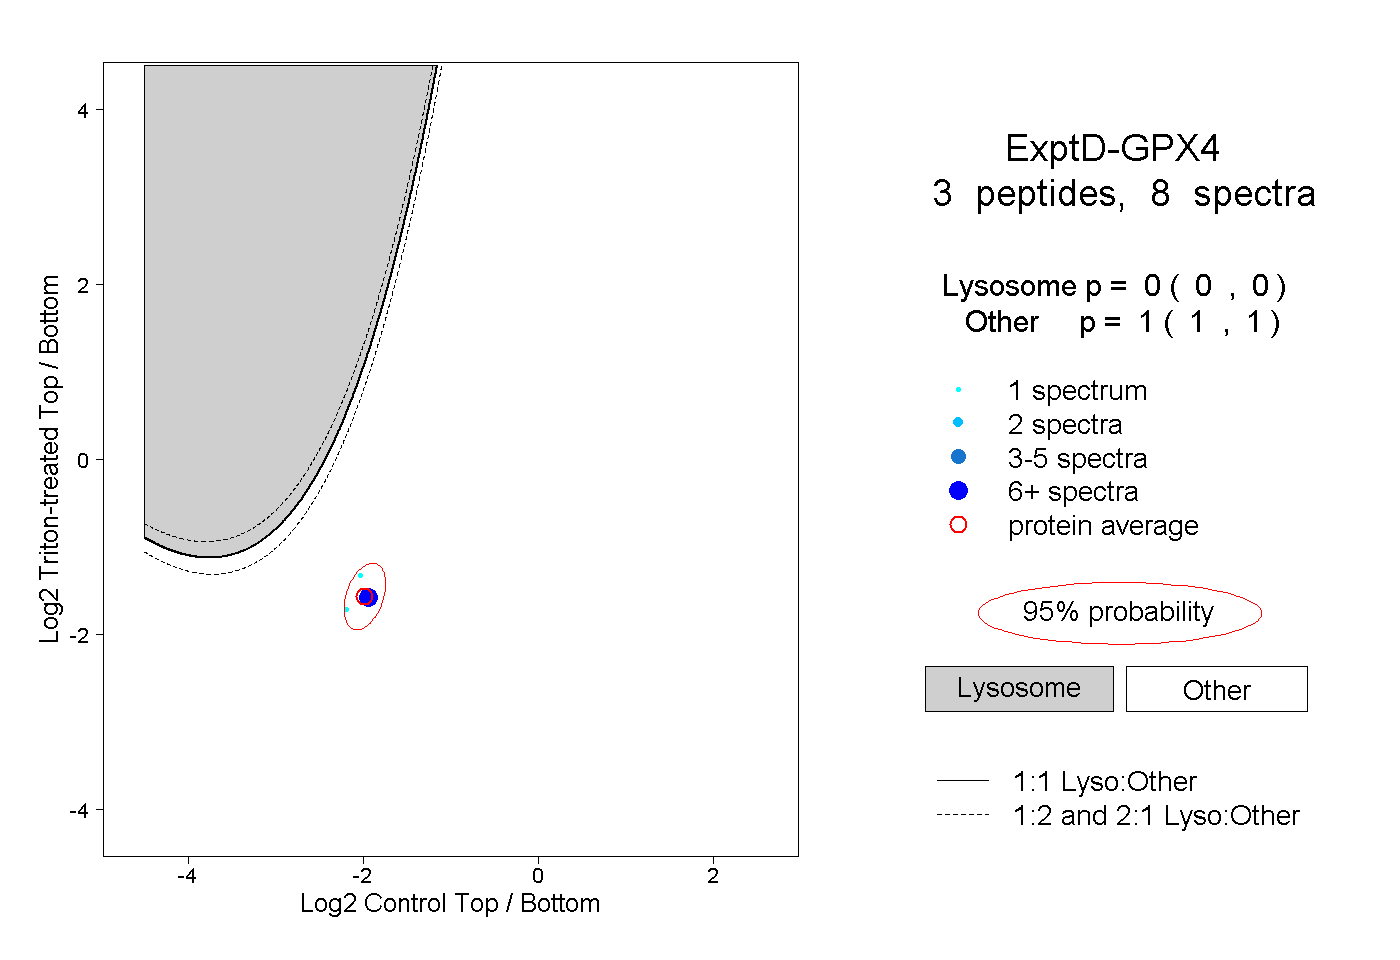 |
0.000 0.000 | 0.000 |
1.000 1.000 | 1.000 |