 6
6peptides
spectra
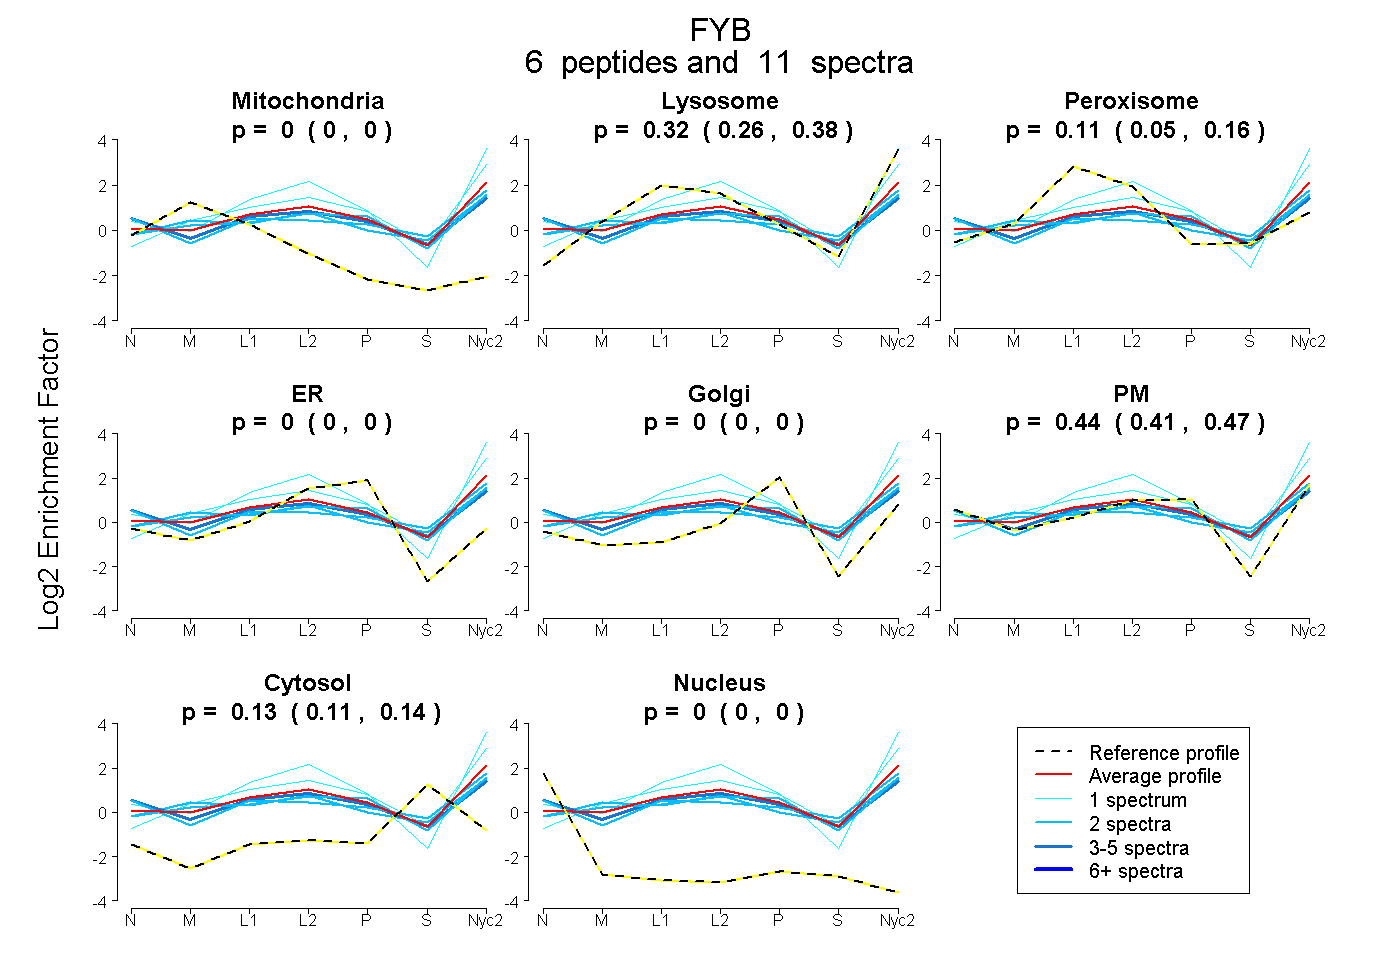
0.000 | 0.000
0.261 | 0.384
0.051 | 0.157
0.000 | 0.000
0.000 | 0.000
0.407 | 0.465
0.110 | 0.144
0.000 | 0.000
11peptides
spectra
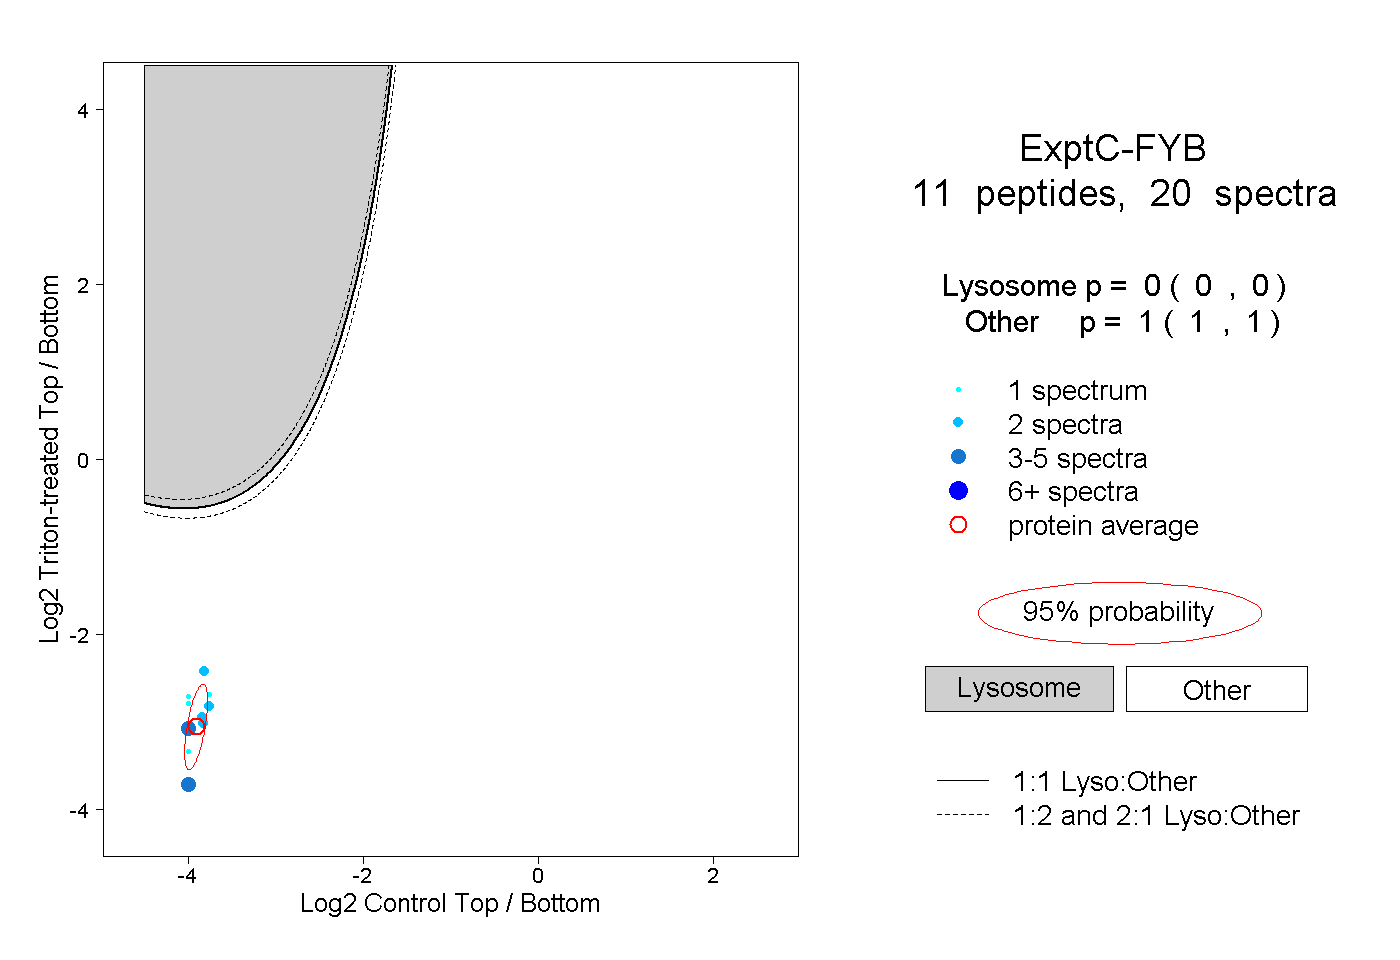
0.000 | 0.000
1.000 | 1.000
2peptides
spectra
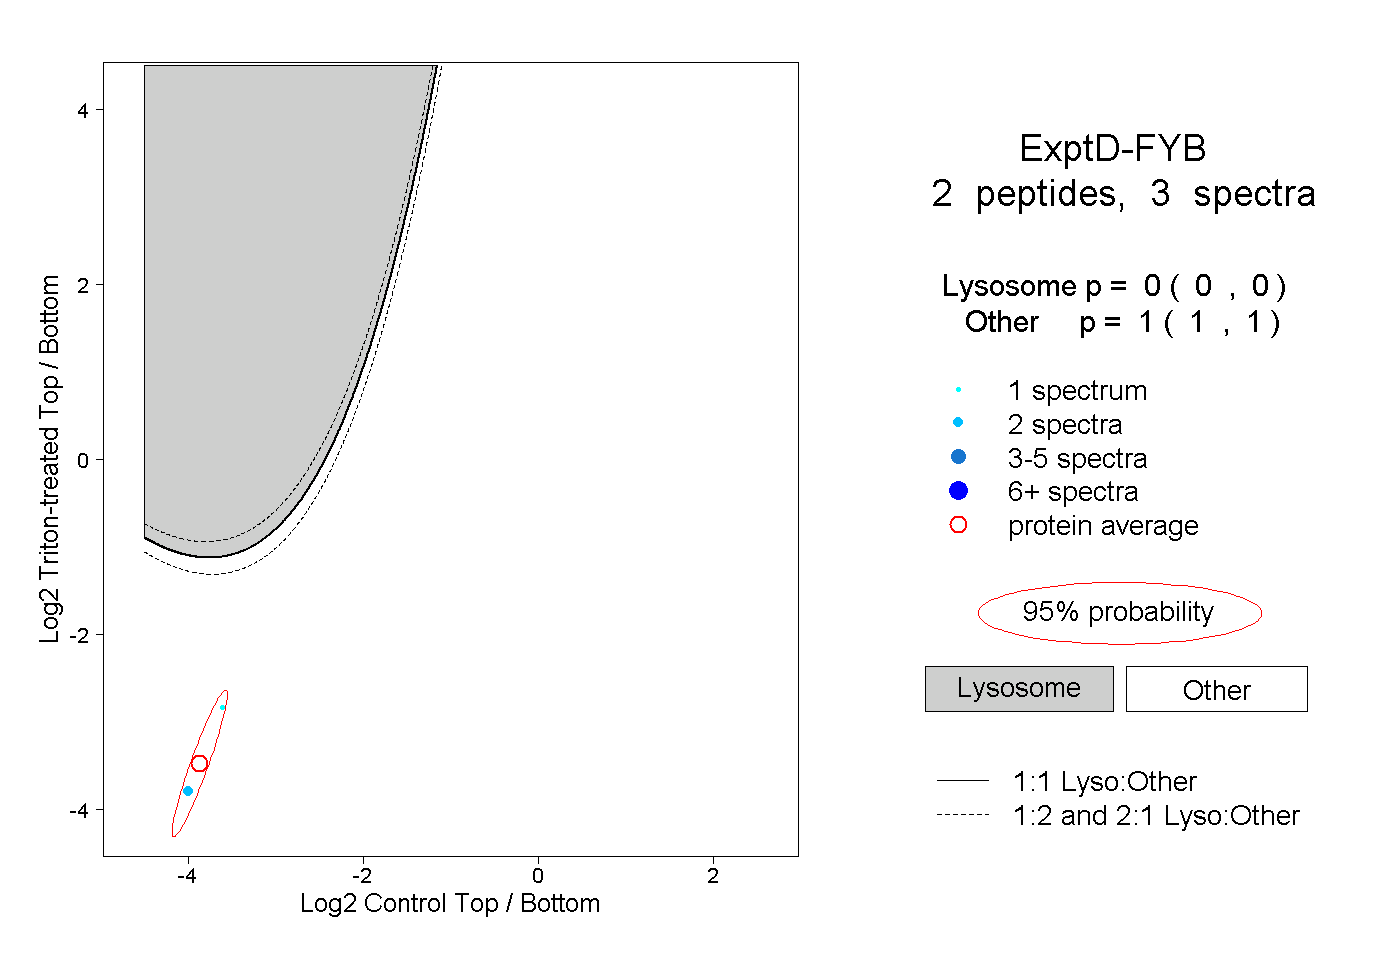
0.000 | 0.000
1.000 | 1.000