 6
6peptides
spectra
0.000 | 0.000
0.261 | 0.384
0.051 | 0.157
0.000 | 0.000
0.000 | 0.000
0.407 | 0.465
0.110 | 0.144
0.000 | 0.000
| Plot | Mito | Lyso | Perox | ER | Golgi | PM | Cytosol | Nucleus | |||||
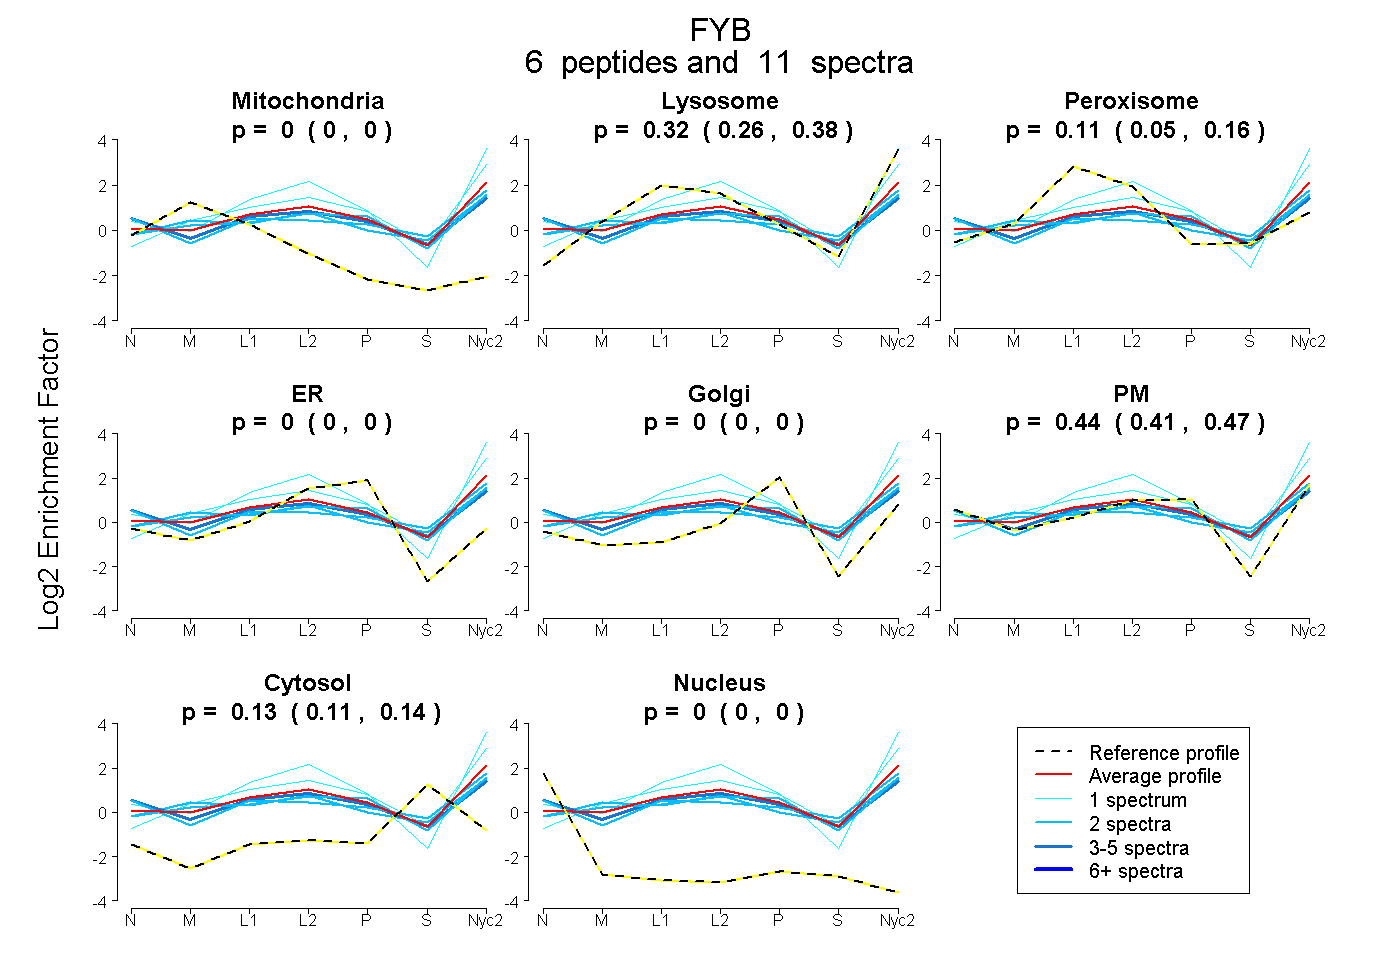
| Expt A |
6 peptides |
11 spectra |
|
0.000 0.000 | 0.000 |
0.324 0.261 | 0.384 |
0.109 0.051 | 0.157 |
0.000 0.000 | 0.000 |
0.000 0.000 | 0.000 |
0.438 0.407 | 0.465 |
0.129 0.110 | 0.144 |
0.000 0.000 | 0.000 |
| 2 spectra, YGYVLR | 0.000 | 0.159 | 0.131 | 0.000 | 0.000 | 0.471 | 0.239 | 0.000 | ||
| 2 spectra, VAGQNSPSGIQSK | 0.016 | 0.247 | 0.093 | 0.000 | 0.027 | 0.460 | 0.157 | 0.000 | ||
| 1 spectrum, FGTQPNSVSR | 0.000 | 0.575 | 0.000 | 0.000 | 0.000 | 0.425 | 0.000 | 0.000 | ||
| 3 spectra, LTGPIQVIHHAK | 0.000 | 0.030 | 0.257 | 0.000 | 0.000 | 0.552 | 0.161 | 0.000 | ||
| 1 spectrum, FMPAPQDADSKPR | 0.000 | 0.688 | 0.000 | 0.000 | 0.009 | 0.247 | 0.057 | 0.000 | ||
| 2 spectra, LNQEEPAR | 0.067 | 0.306 | 0.118 | 0.000 | 0.000 | 0.318 | 0.191 | 0.000 |
| Plot | Lyso | Other | |||||||||||
| Expt C |
11 peptides |
20 spectra |
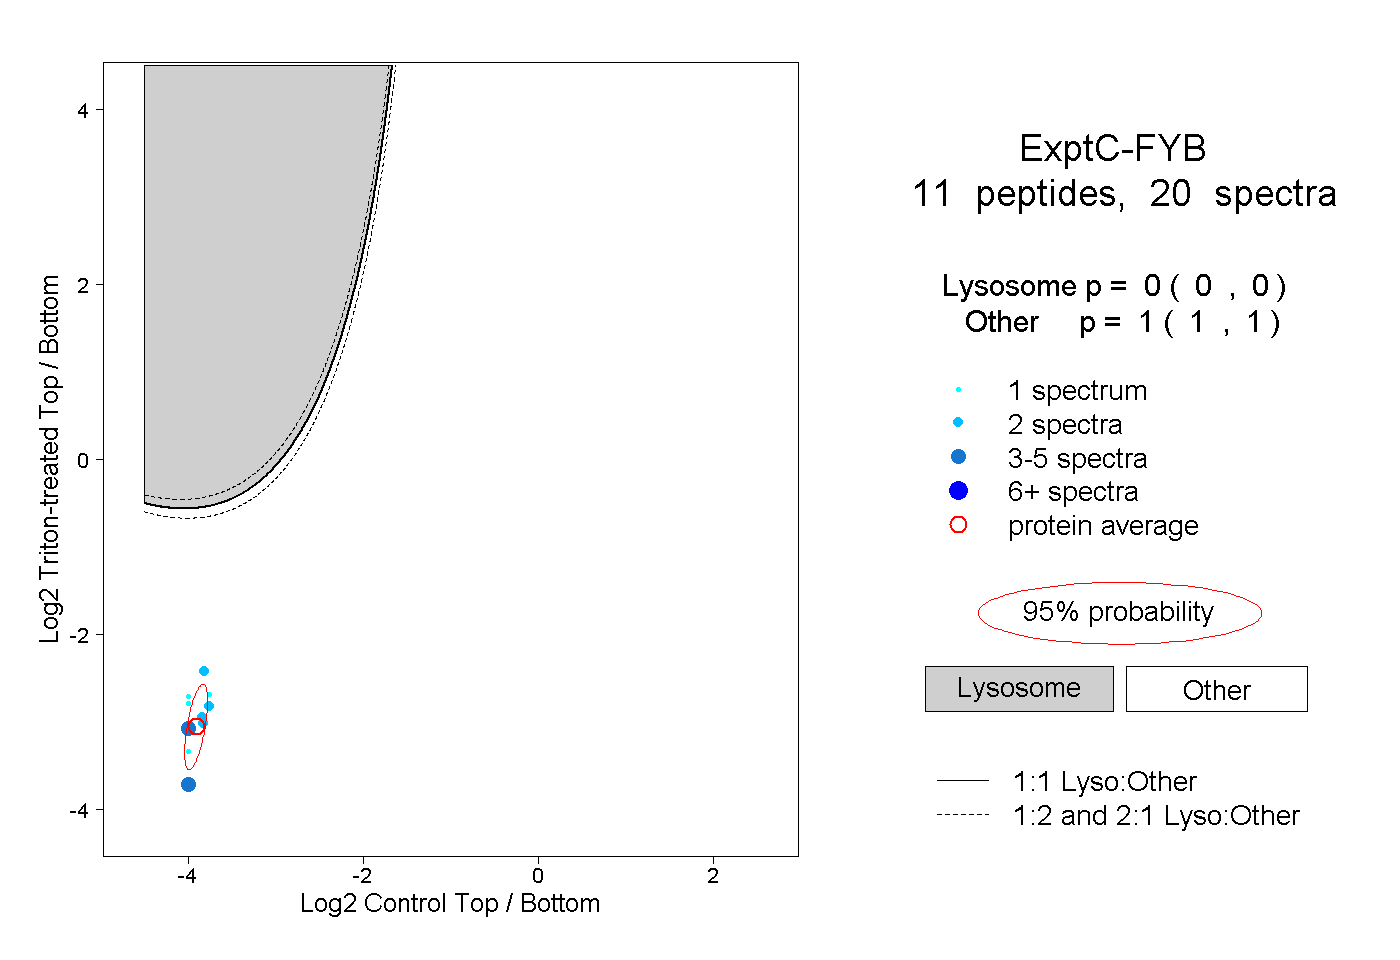 |
0.000 0.000 | 0.000 |
1.000 1.000 | 1.000 |
||||||||
| Plot | Lyso | Other | |||||||||||
| Expt D |
2 peptides |
3 spectra |
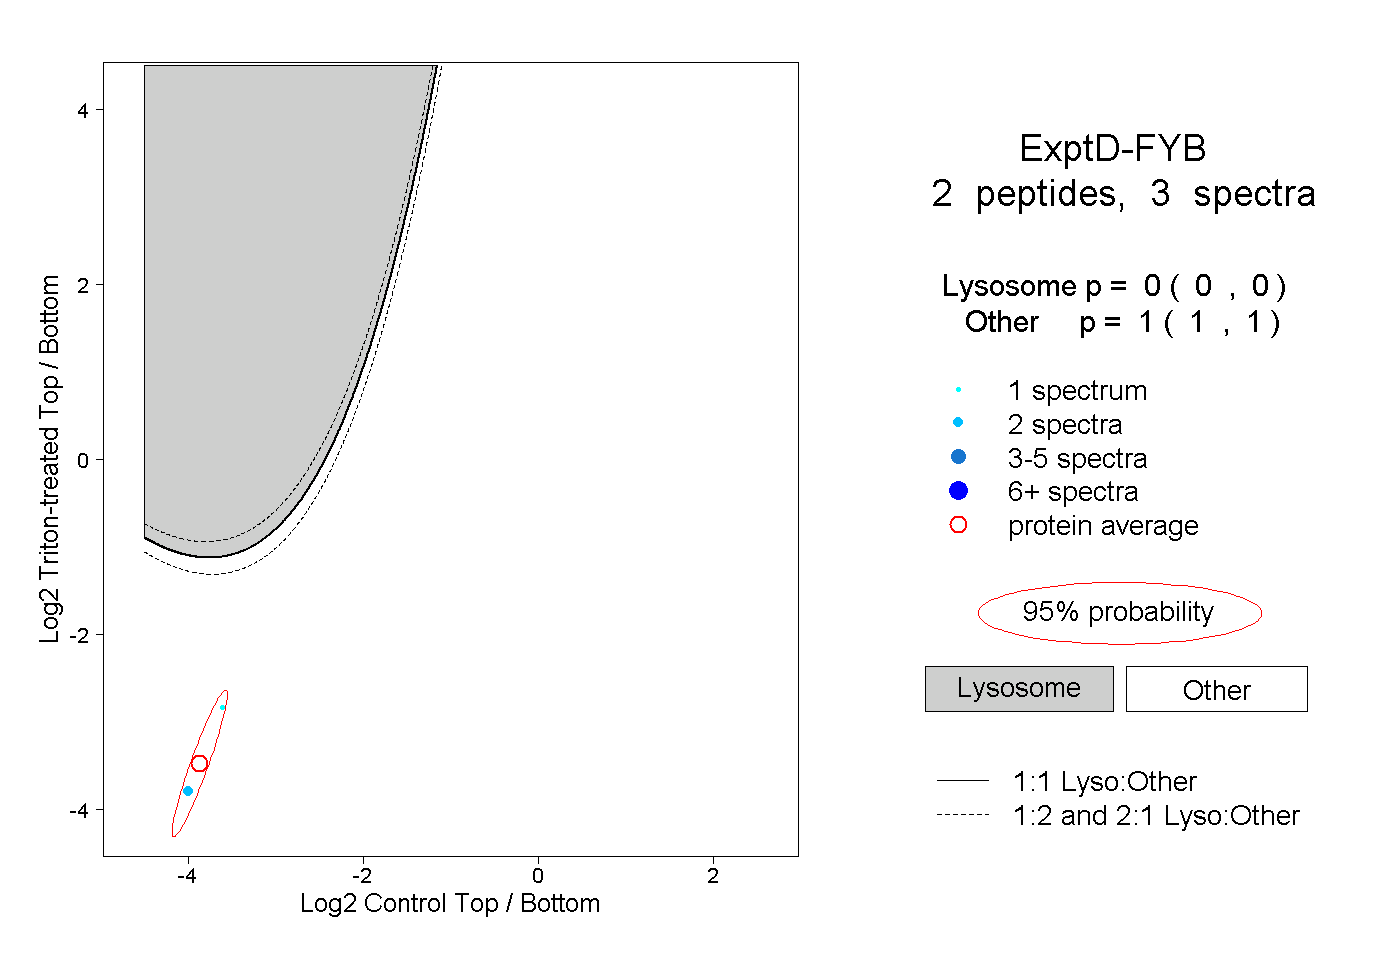 |
0.000 0.000 | 0.000 |
1.000 1.000 | 1.000 |