 6
6peptides
spectra
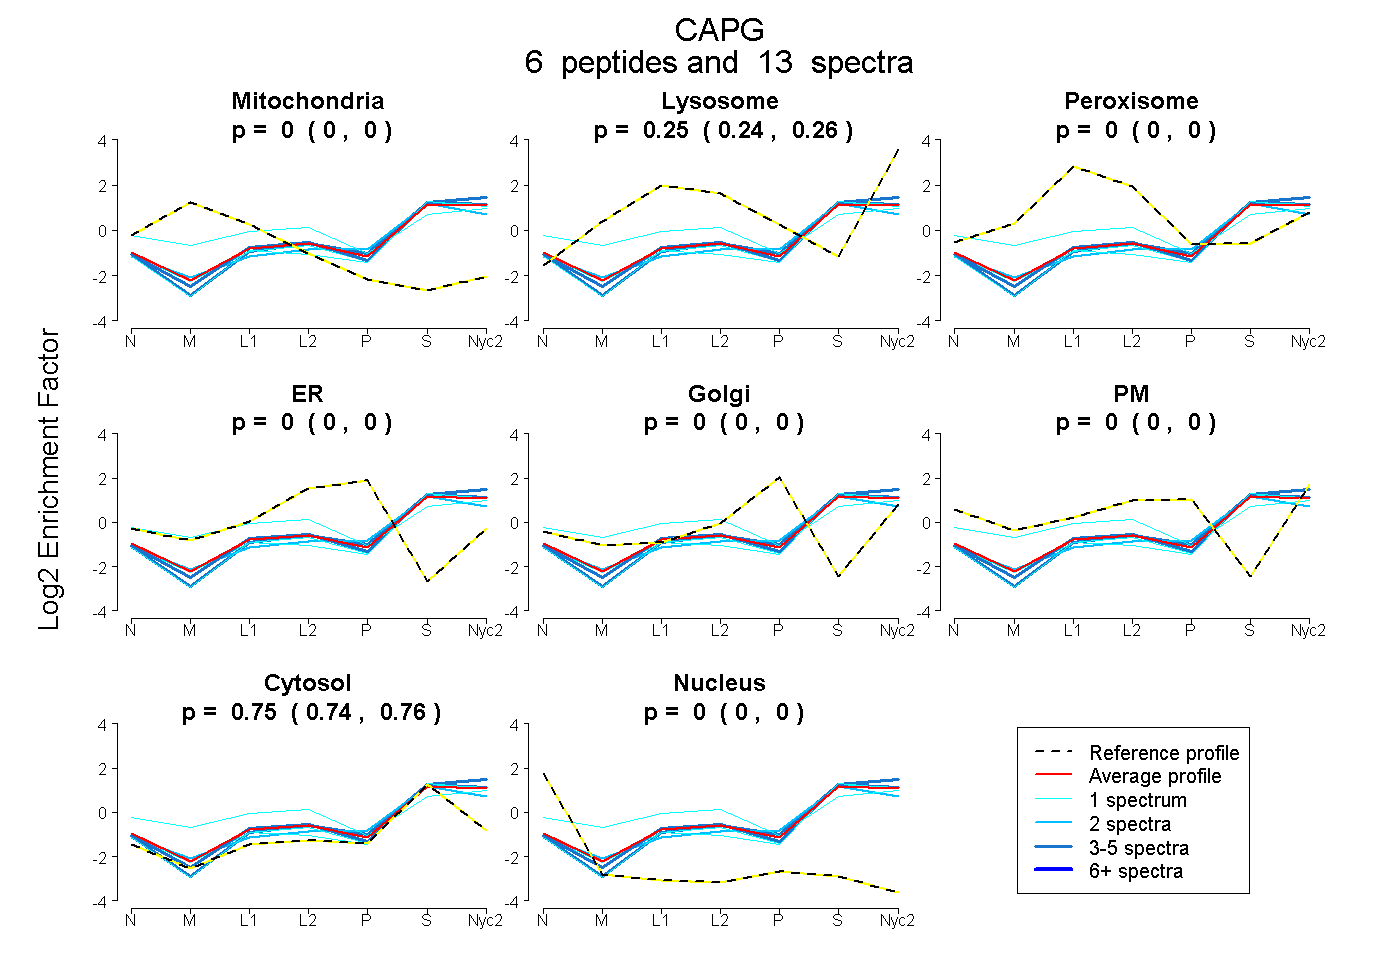
0.000 | 0.000
0.237 | 0.260
0.000 | 0.000
0.000 | 0.000
0.000 | 0.000
0.000 | 0.000
0.737 | 0.761
0.000 | 0.000
2peptides
spectra
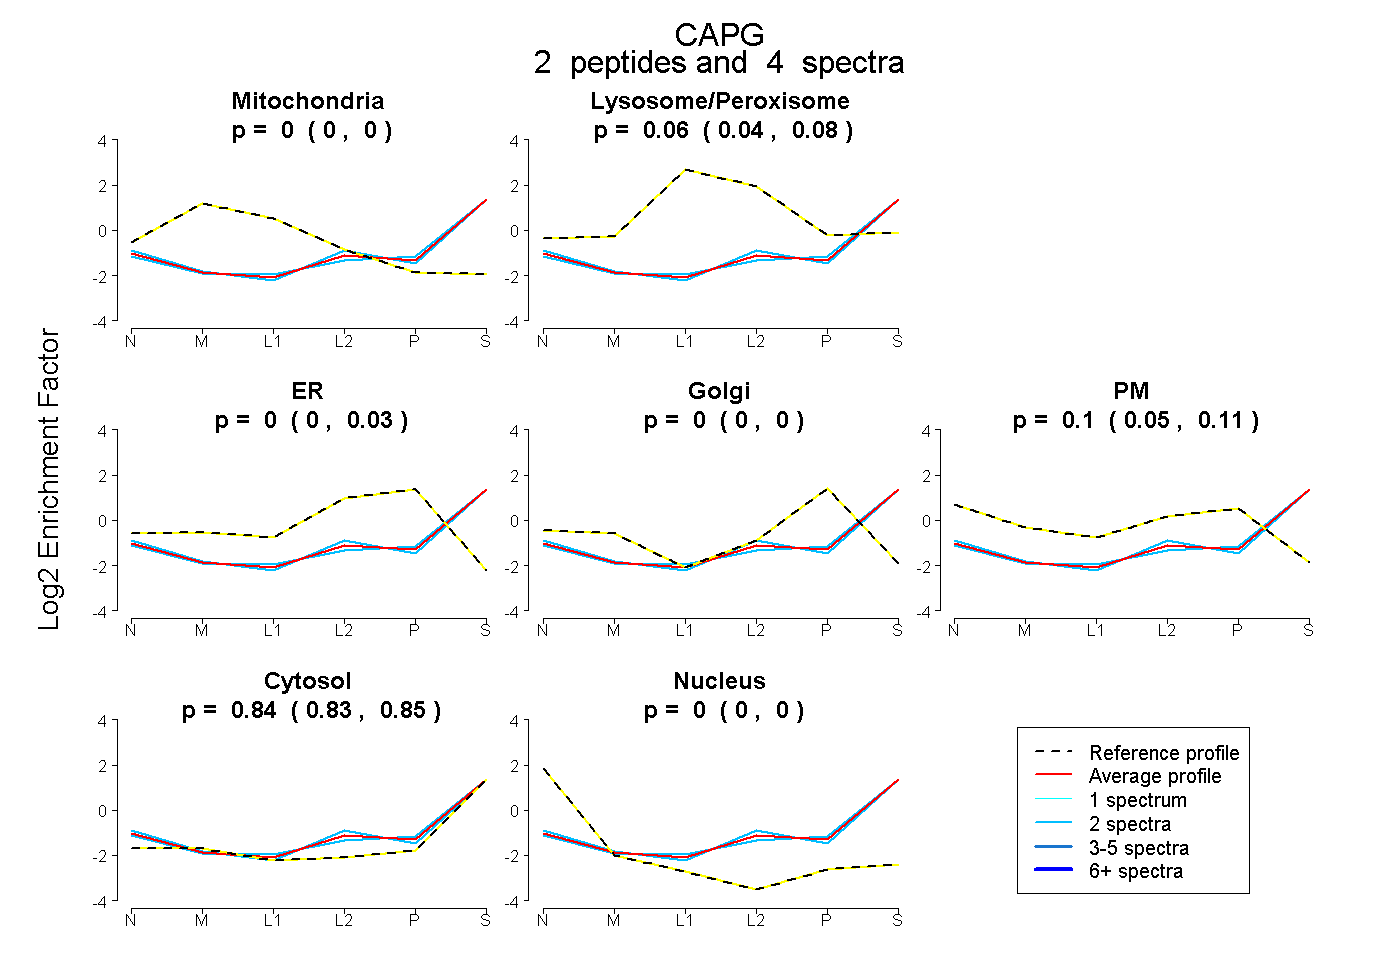
0.000 | 0.000
0.042 | 0.078
0.000 | 0.034
0.000 | 0.000
0.054 | 0.108
0.829 | 0.853
0.000 | 0.000
7peptides
spectra
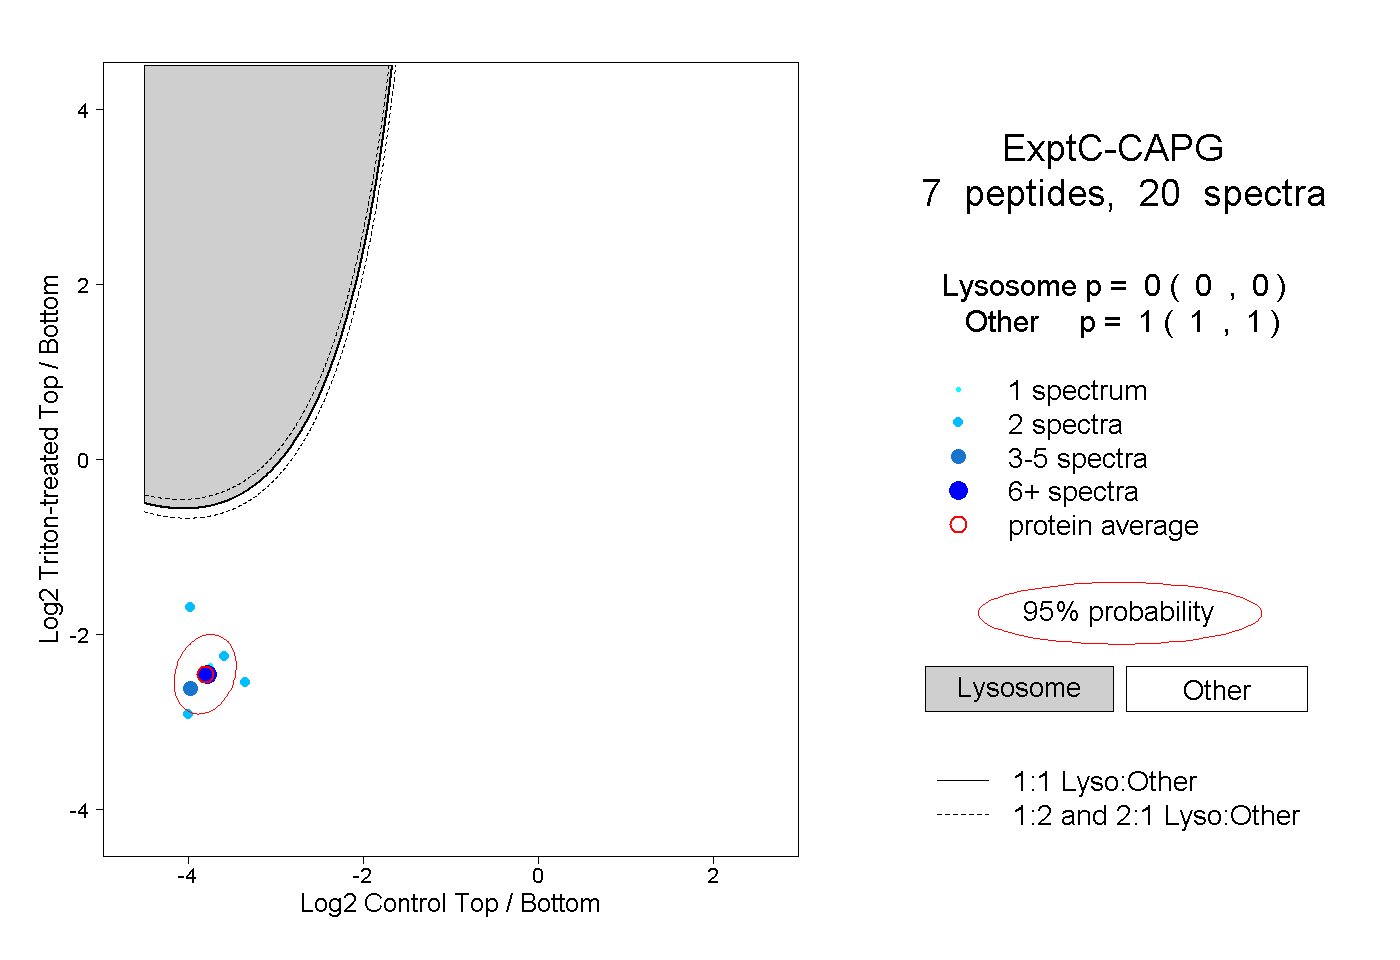
0.000 | 0.000
1.000 | 1.000
3peptides
spectra
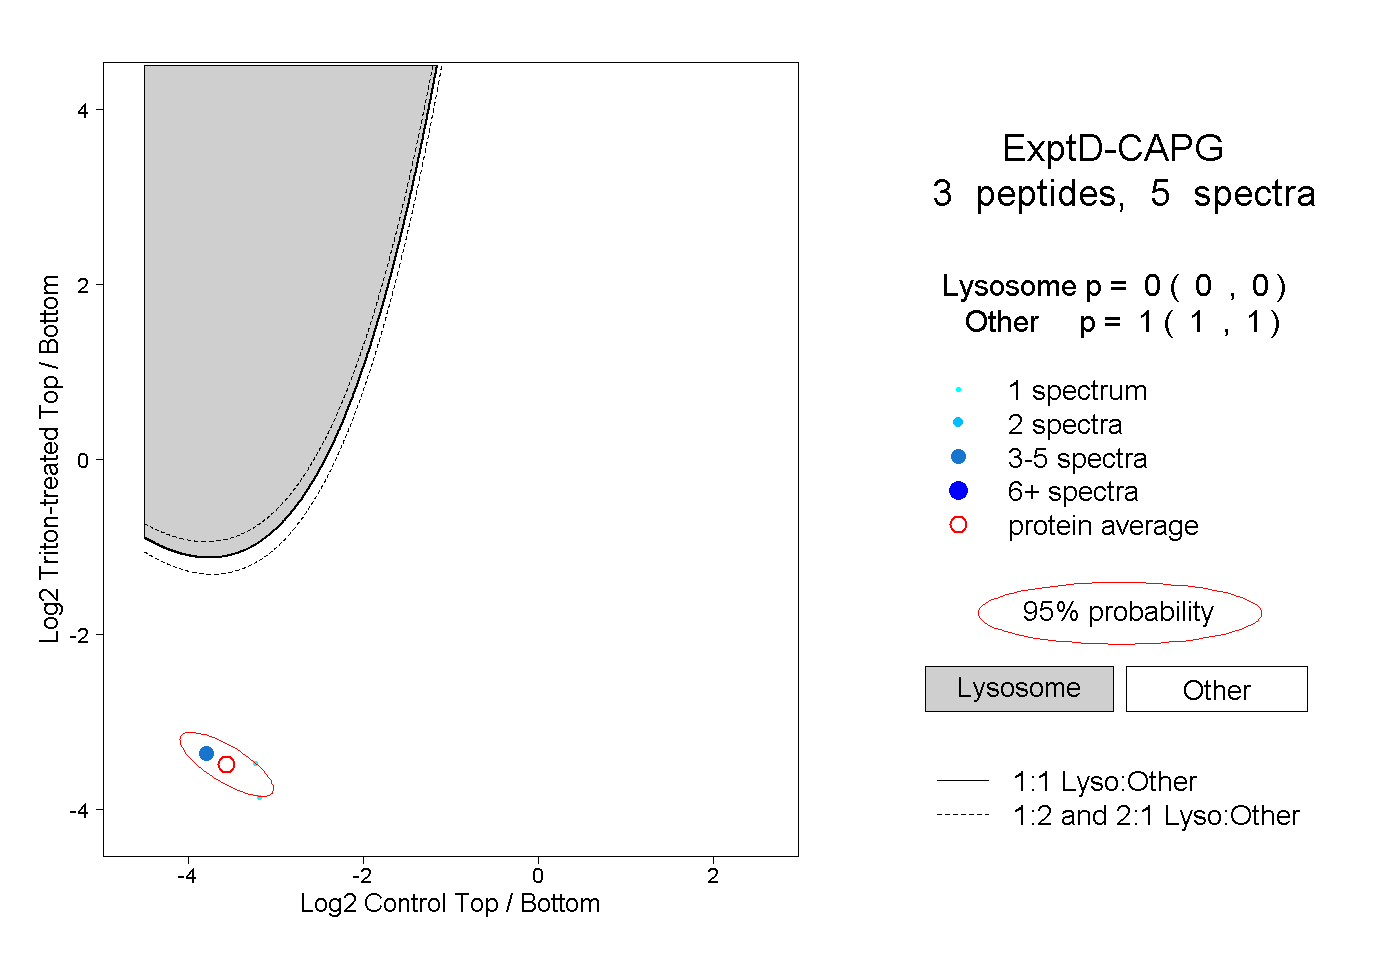
0.000 | 0.000
1.000 | 1.000