 6
6peptides
spectra
0.000 | 0.000
0.237 | 0.260
0.000 | 0.000
0.000 | 0.000
0.000 | 0.000
0.000 | 0.000
0.737 | 0.761
0.000 | 0.000
| Plot | Mito | Lyso | Perox | ER | Golgi | PM | Cytosol | Nucleus | |||||
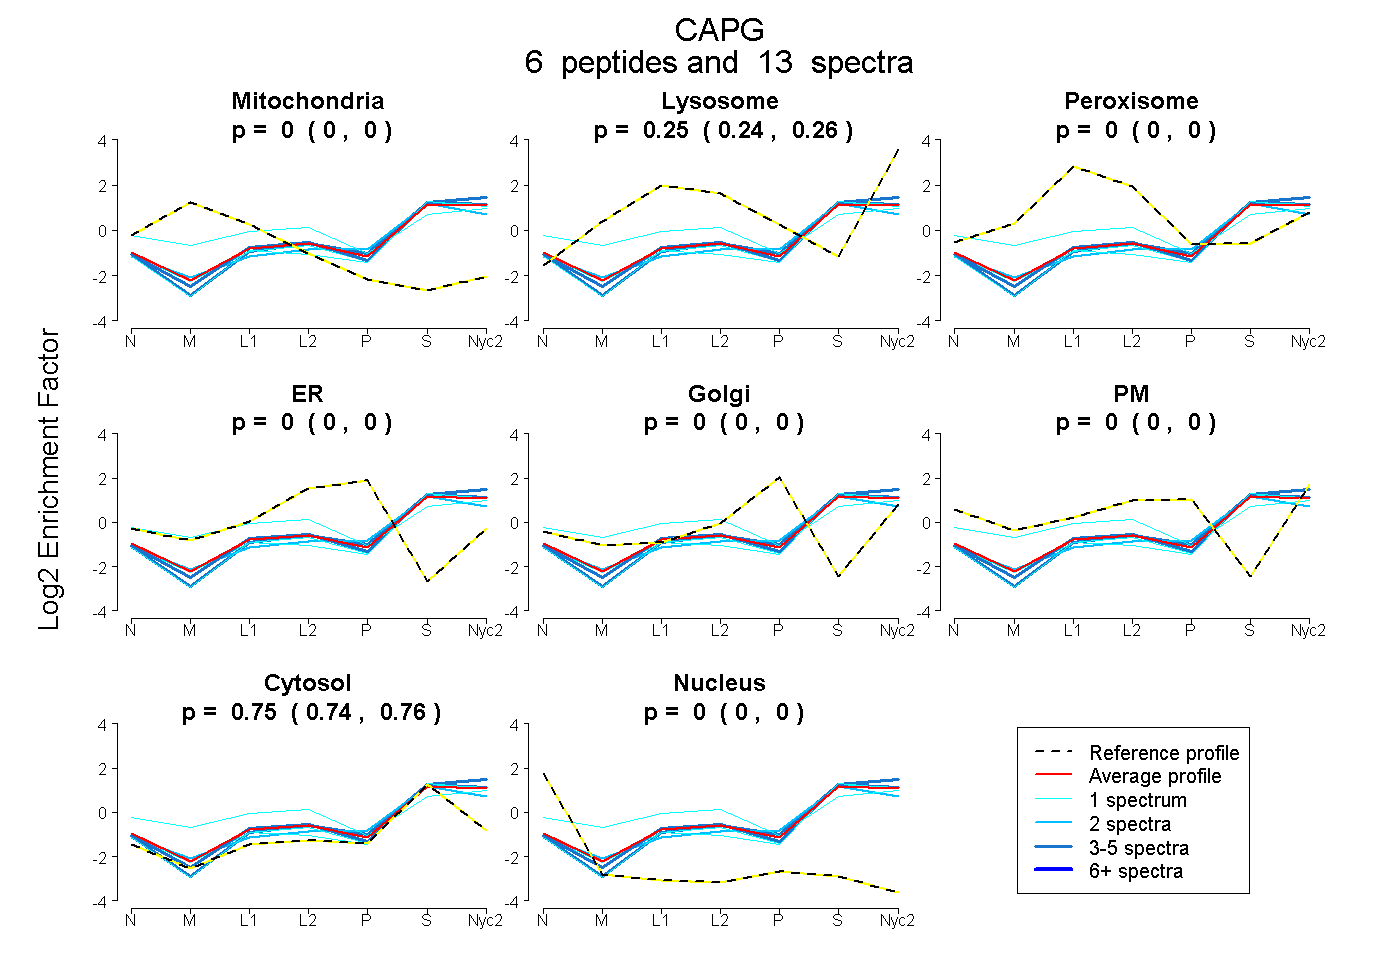
| Expt A |
6 peptides |
13 spectra |
|
0.000 0.000 | 0.000 |
0.250 0.237 | 0.260 |
0.000 0.000 | 0.000 |
0.000 0.000 | 0.000 |
0.000 0.000 | 0.000 |
0.000 0.000 | 0.000 |
0.750 0.737 | 0.761 |
0.000 0.000 | 0.000 |
| 4 spectra, TTSGTTPAAIR | 0.000 | 0.263 | 0.000 | 0.000 | 0.000 | 0.000 | 0.737 | 0.000 | ||
| 1 spectrum, VSDATGQMNLTK | 0.000 | 0.178 | 0.216 | 0.000 | 0.000 | 0.101 | 0.506 | 0.000 | ||
| 1 spectrum, QAALQVADGFISR | 0.000 | 0.227 | 0.000 | 0.000 | 0.000 | 0.000 | 0.773 | 0.000 | ||
| 1 spectrum, YSPNTQVEILPQGR | 0.000 | 0.168 | 0.000 | 0.000 | 0.000 | 0.000 | 0.832 | 0.000 | ||
| 2 spectra, ESPIFK | 0.000 | 0.199 | 0.000 | 0.000 | 0.001 | 0.000 | 0.800 | 0.000 | ||
| 4 spectra, DLAIAIR | 0.000 | 0.213 | 0.000 | 0.000 | 0.000 | 0.000 | 0.787 | 0.000 |
| Plot | Mito | Lyso or Perox | ER | Golgi | PM | Cytosol | Nucleus | ||||||
| Expt B |
2 peptides |
4 spectra |
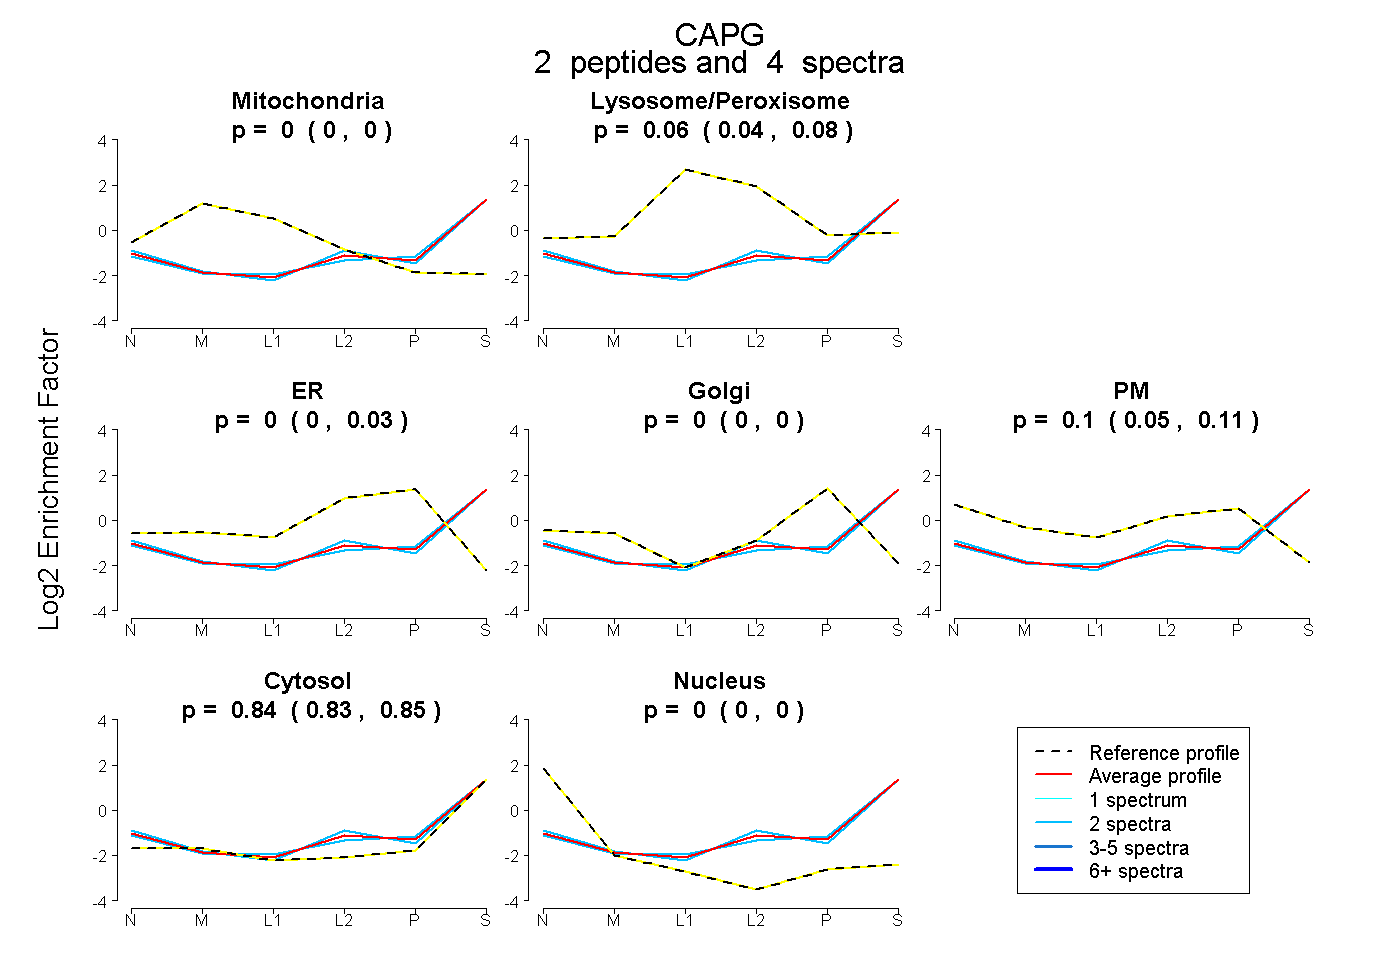 |
0.000 0.000 | 0.000 |
0.063 0.042 | 0.078 |
0.000 0.000 | 0.034 |
0.000 0.000 | 0.000 |
0.096 0.054 | 0.108 |
0.841 0.829 | 0.853 |
0.000 0.000 | 0.000 |
|||
| Plot | Lyso | Other | |||||||||||
| Expt C |
7 peptides |
20 spectra |
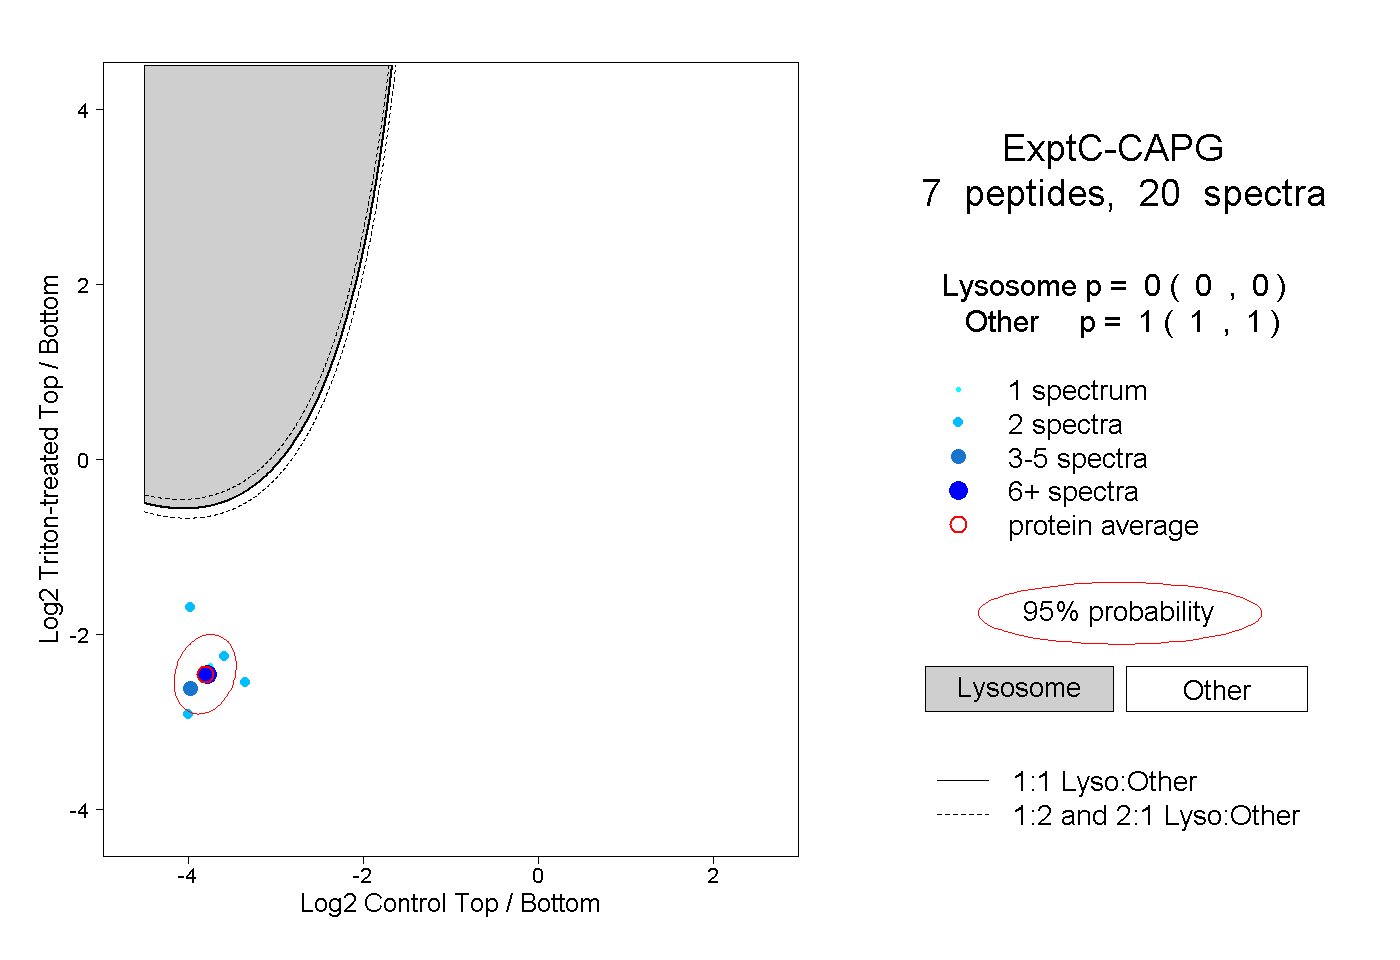 |
0.000 0.000 | 0.000 |
1.000 1.000 | 1.000 |
||||||||
| Plot | Lyso | Other | |||||||||||
| Expt D |
3 peptides |
5 spectra |
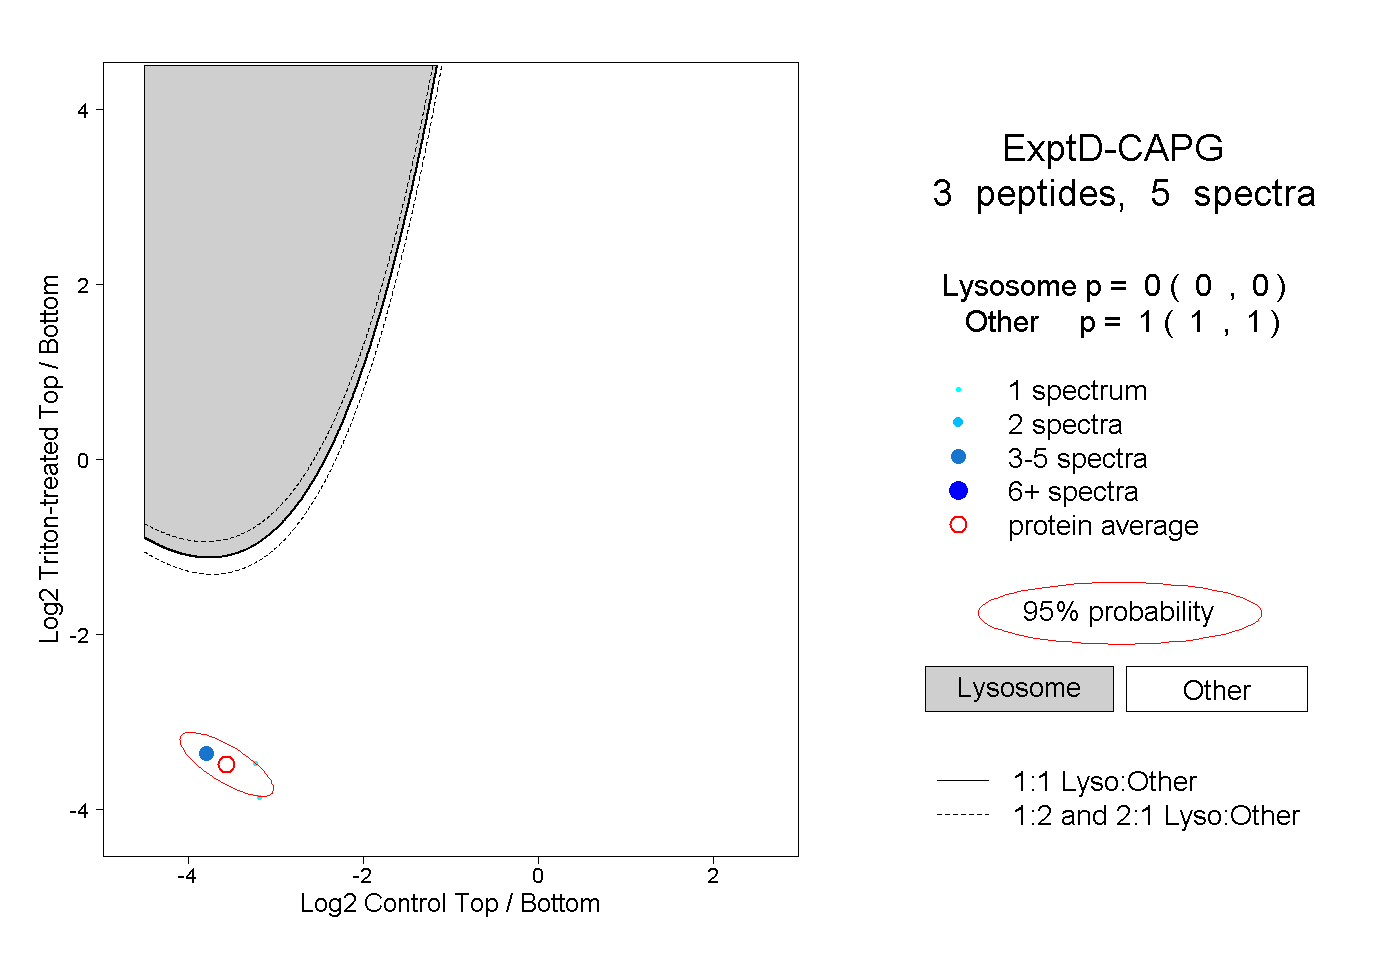 |
0.000 0.000 | 0.000 |
1.000 1.000 | 1.000 |