 3
3peptides
spectra
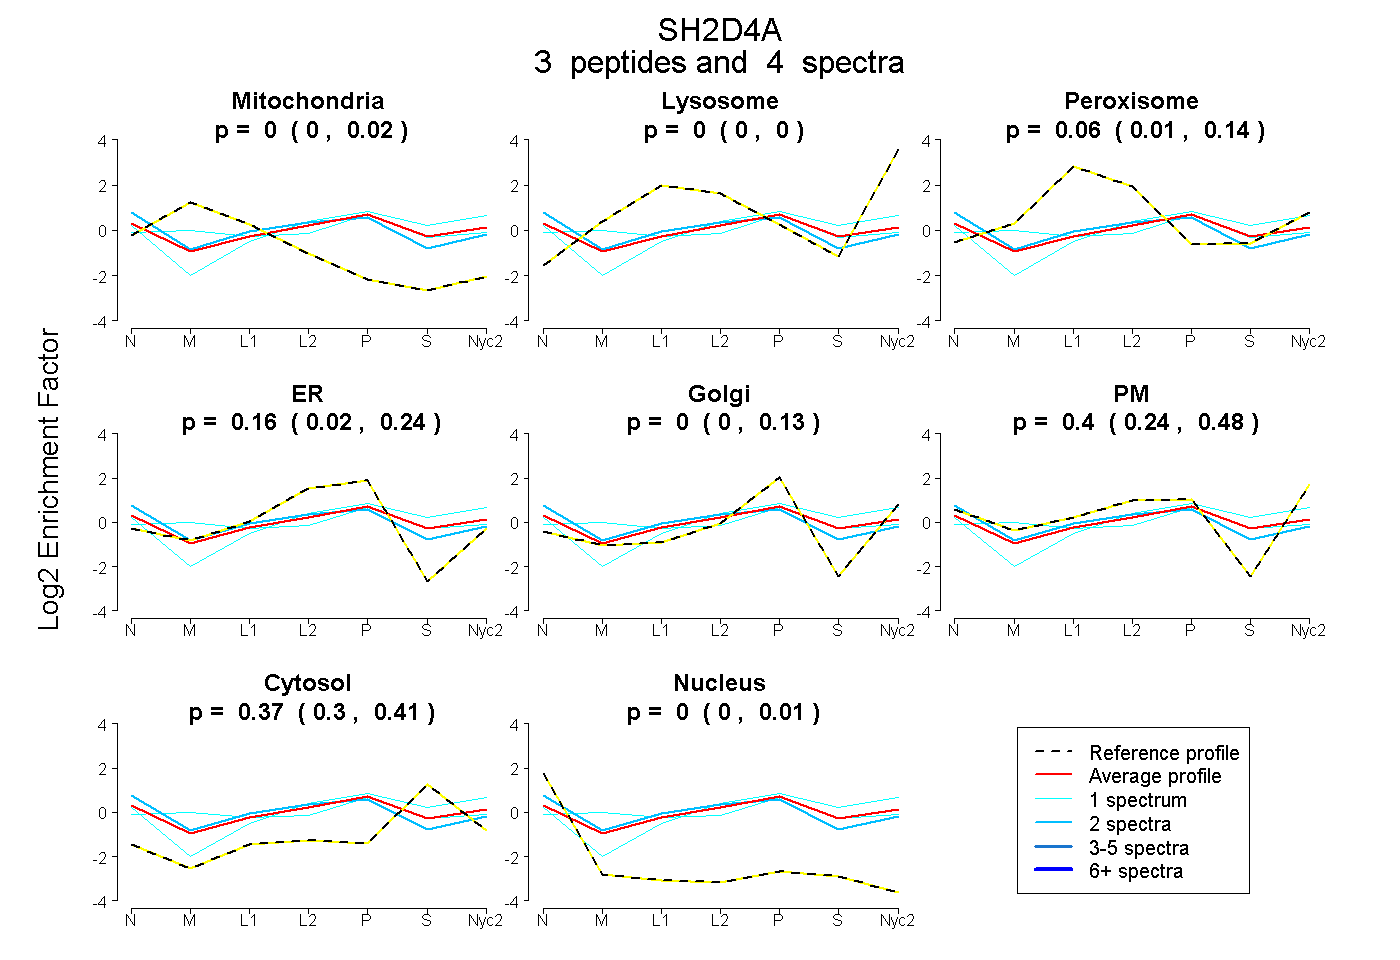
0.000 | 0.016
0.000 | 0.000
0.006 | 0.138
0.021 | 0.239
0.000 | 0.125
0.242 | 0.482
0.304 | 0.411
0.000 | 0.009
2peptides
spectra
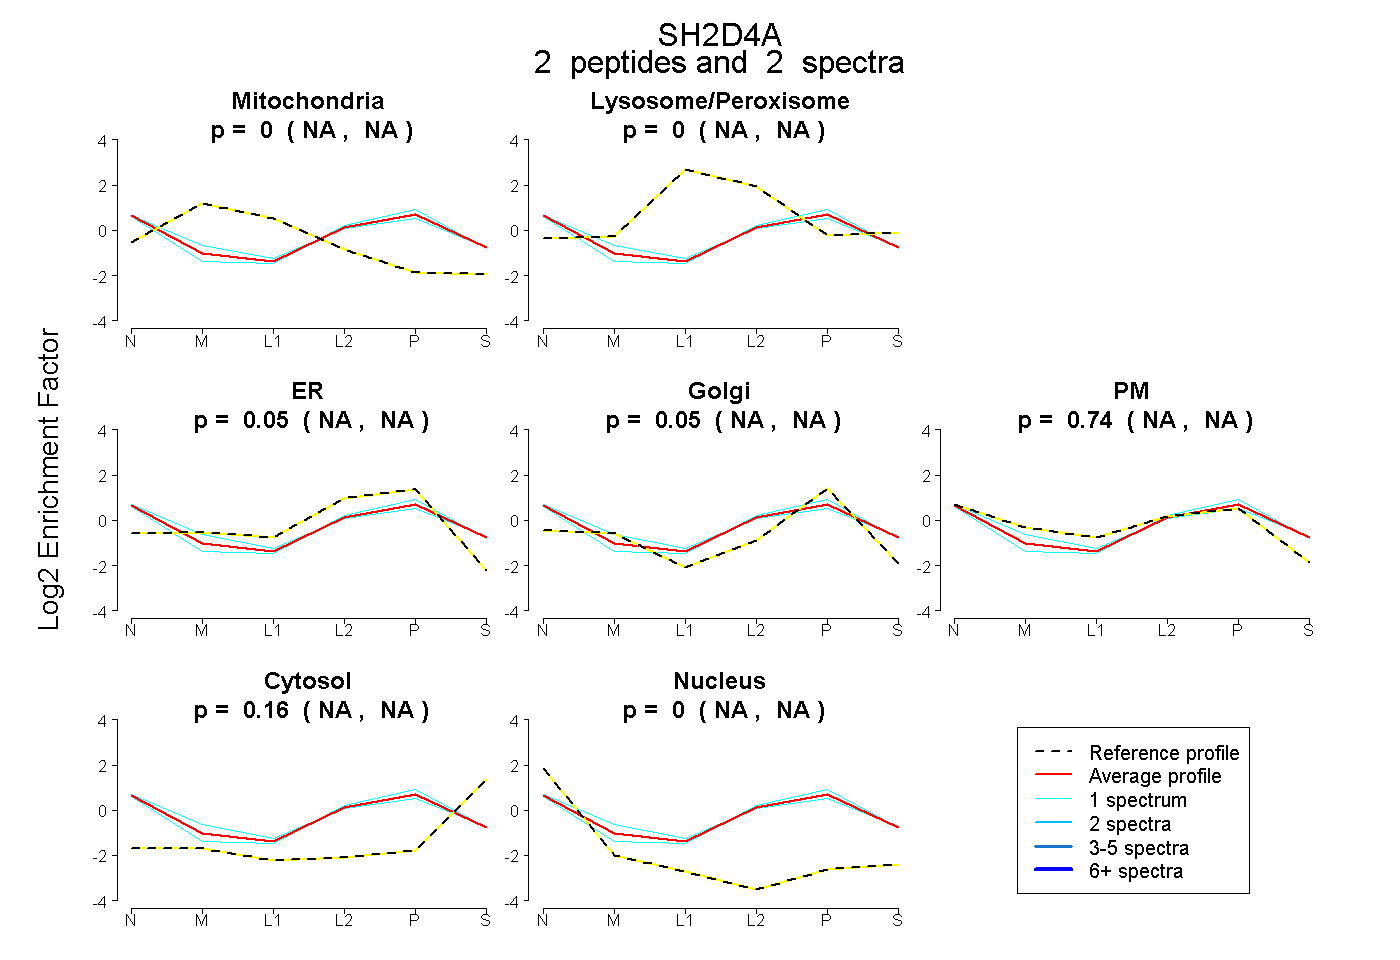
NA | NA
NA | NA
NA | NA
NA | NA
NA | NA
NA | NA
NA | NA
4peptides
spectra
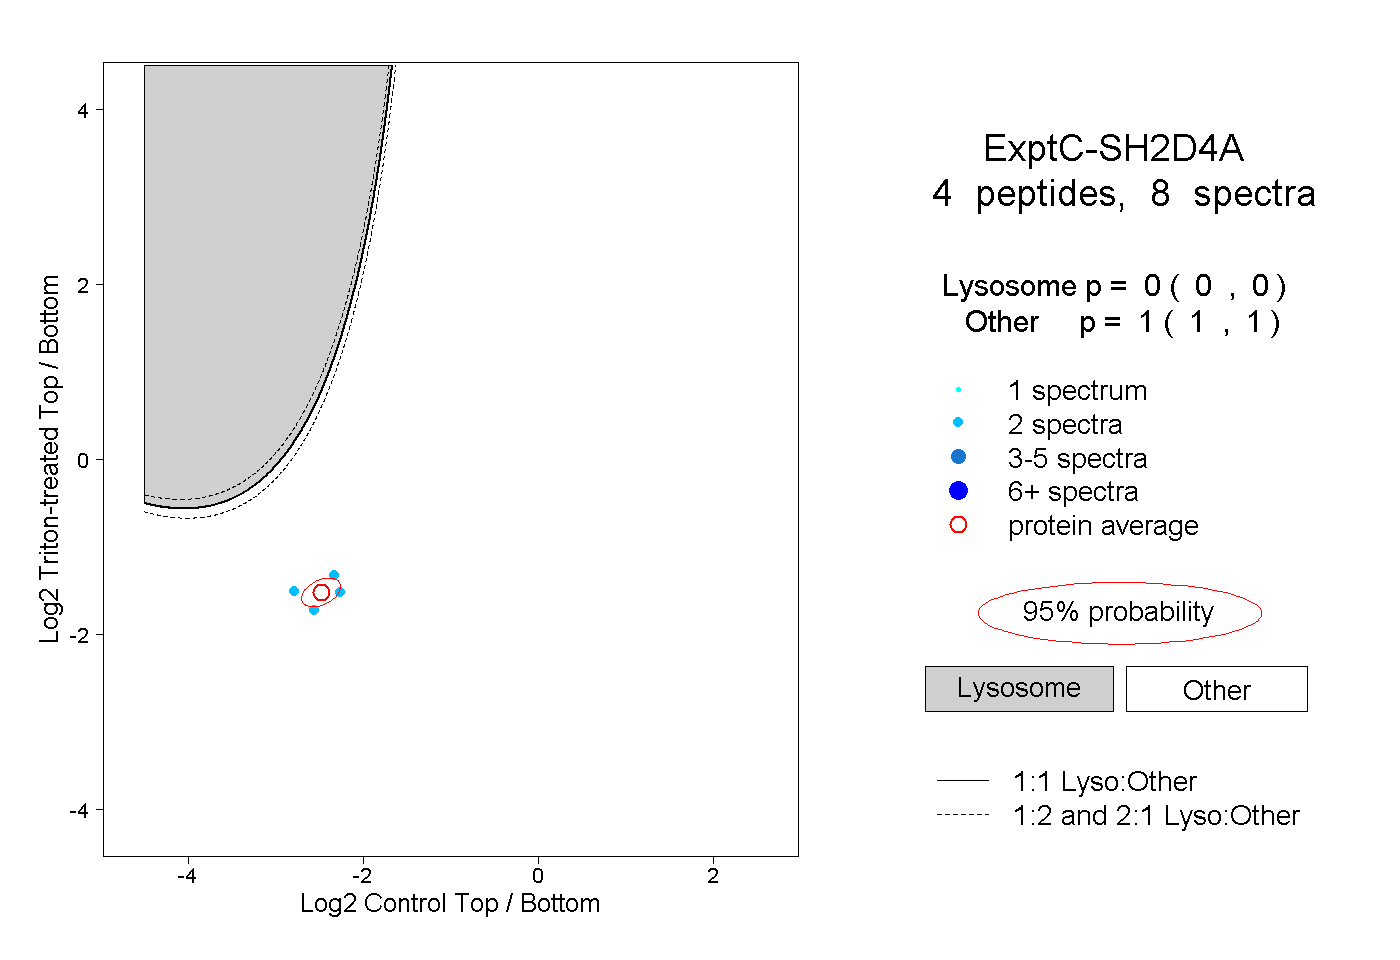
0.000 | 0.000
1.000 | 1.000
2peptides
spectra
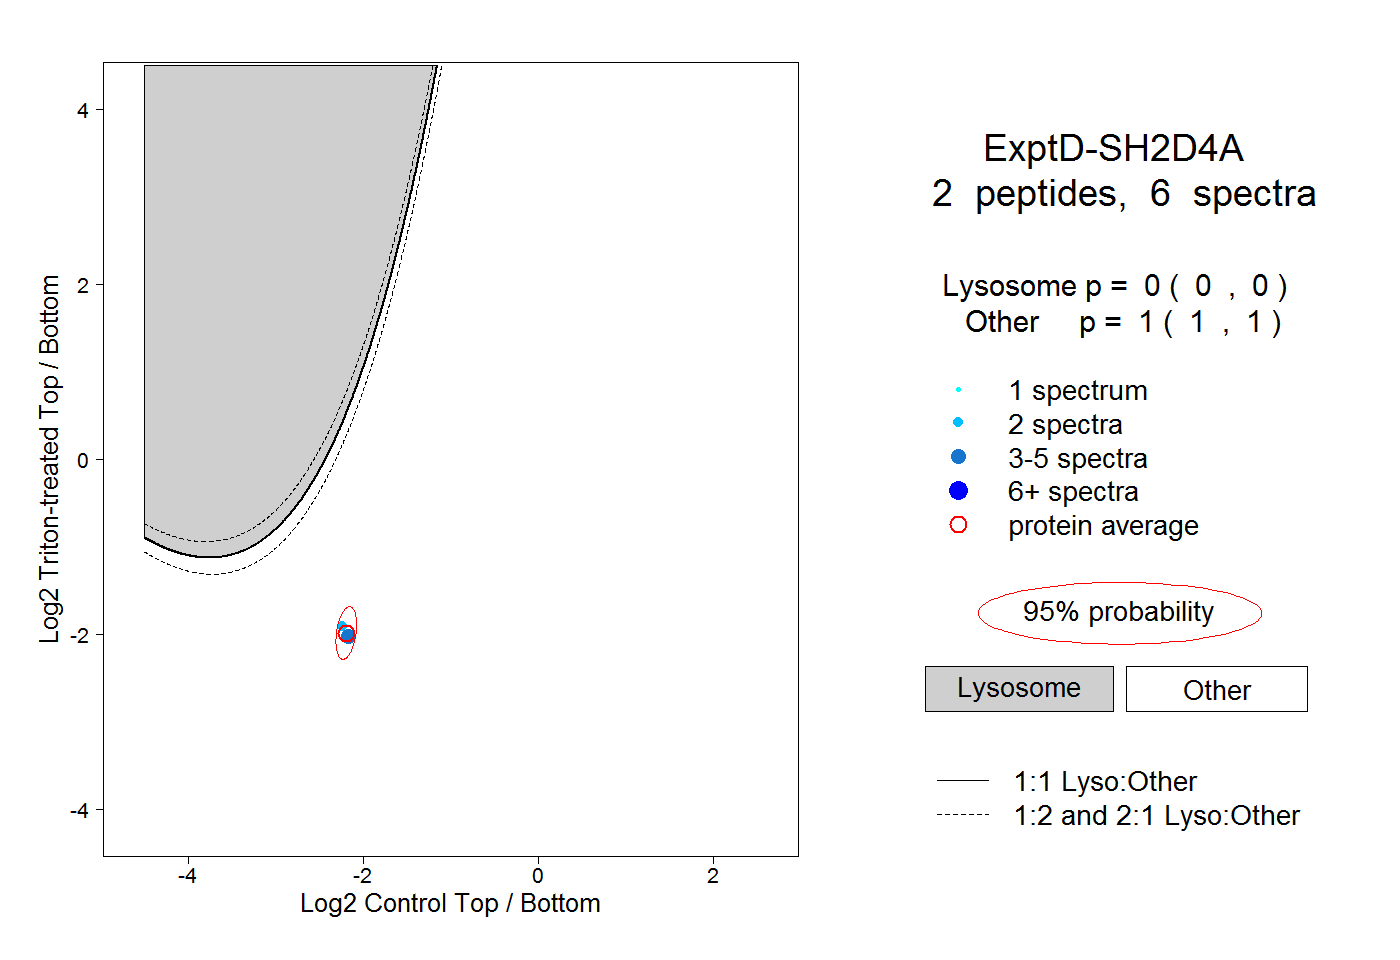
0.000 | 0.000
1.000 | 1.000