 3
3peptides
spectra
0.000 | 0.016
0.000 | 0.000
0.006 | 0.138
0.021 | 0.239
0.000 | 0.125
0.242 | 0.482
0.304 | 0.411
0.000 | 0.009
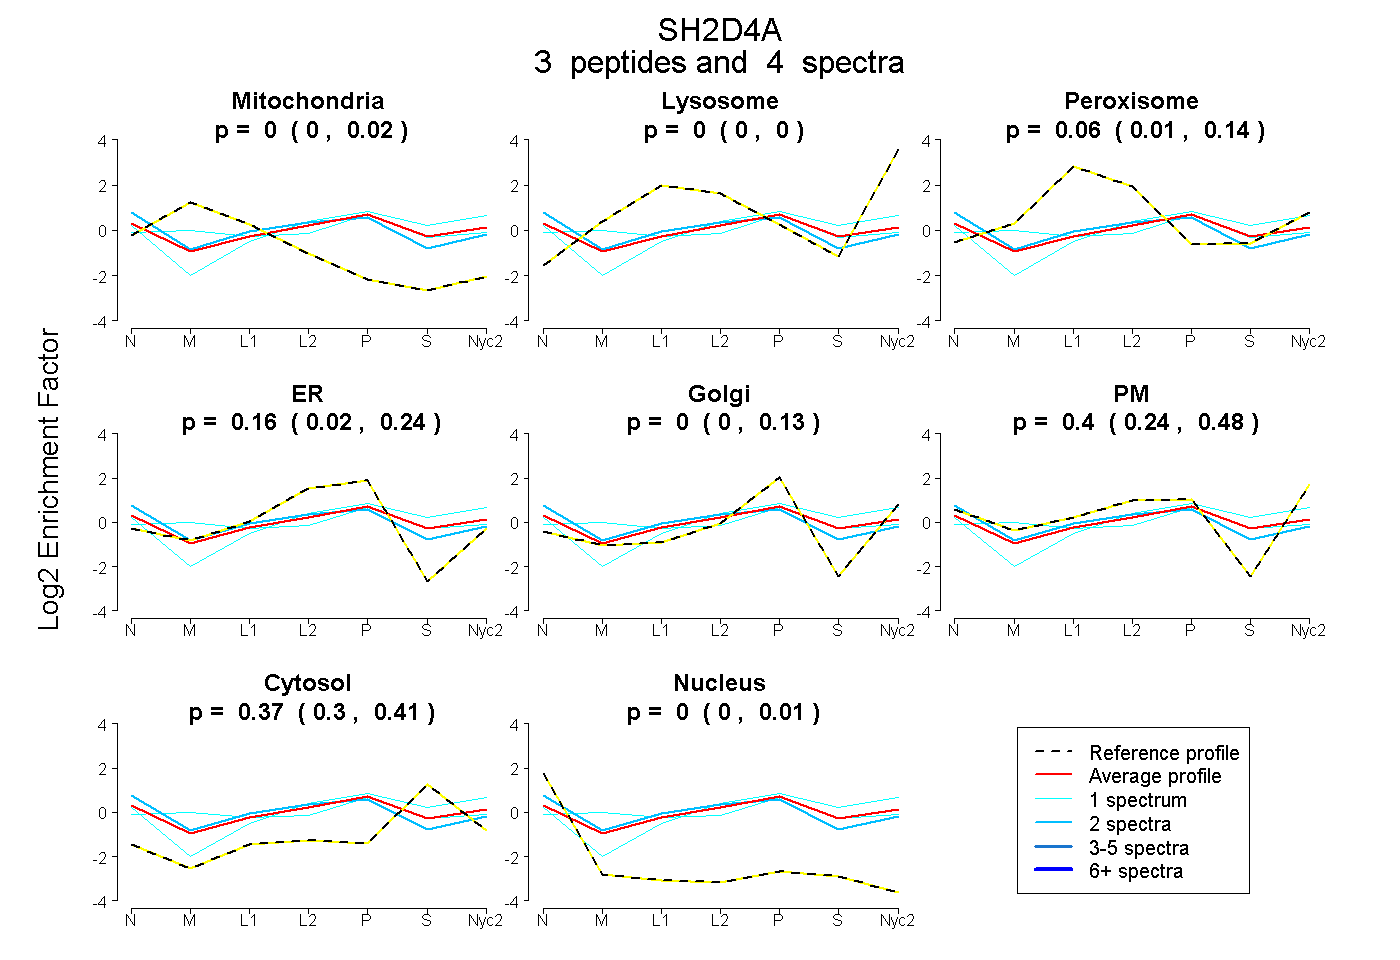
| Plot | Mito | Lyso | Perox | ER | Golgi | PM | Cytosol | Nucleus | |||||
| Expt A |
3 peptides |
4 spectra |
|
0.000 0.000 | 0.016 |
0.000 0.000 | 0.000 |
0.064 0.006 | 0.138 |
0.164 0.021 | 0.239 |
0.000 0.000 | 0.125 |
0.397 0.242 | 0.482 |
0.375 0.304 | 0.411 |
0.000 0.000 | 0.009 |
| 1 spectrum, TEPQNVTR | 0.000 | 0.000 | 0.000 | 0.060 | 0.000 | 0.483 | 0.457 | 0.000 | ||
| 1 spectrum, SLNCDLQAVK | 0.104 | 0.000 | 0.239 | 0.000 | 0.417 | 0.000 | 0.241 | 0.000 | ||
| 2 spectra, TSSTQEDIIR | 0.000 | 0.000 | 0.160 | 0.203 | 0.000 | 0.336 | 0.205 | 0.096 |
| Plot | Mito | Lyso or Perox | ER | Golgi | PM | Cytosol | Nucleus | ||||||
| Expt B |
2 peptides |
2 spectra |
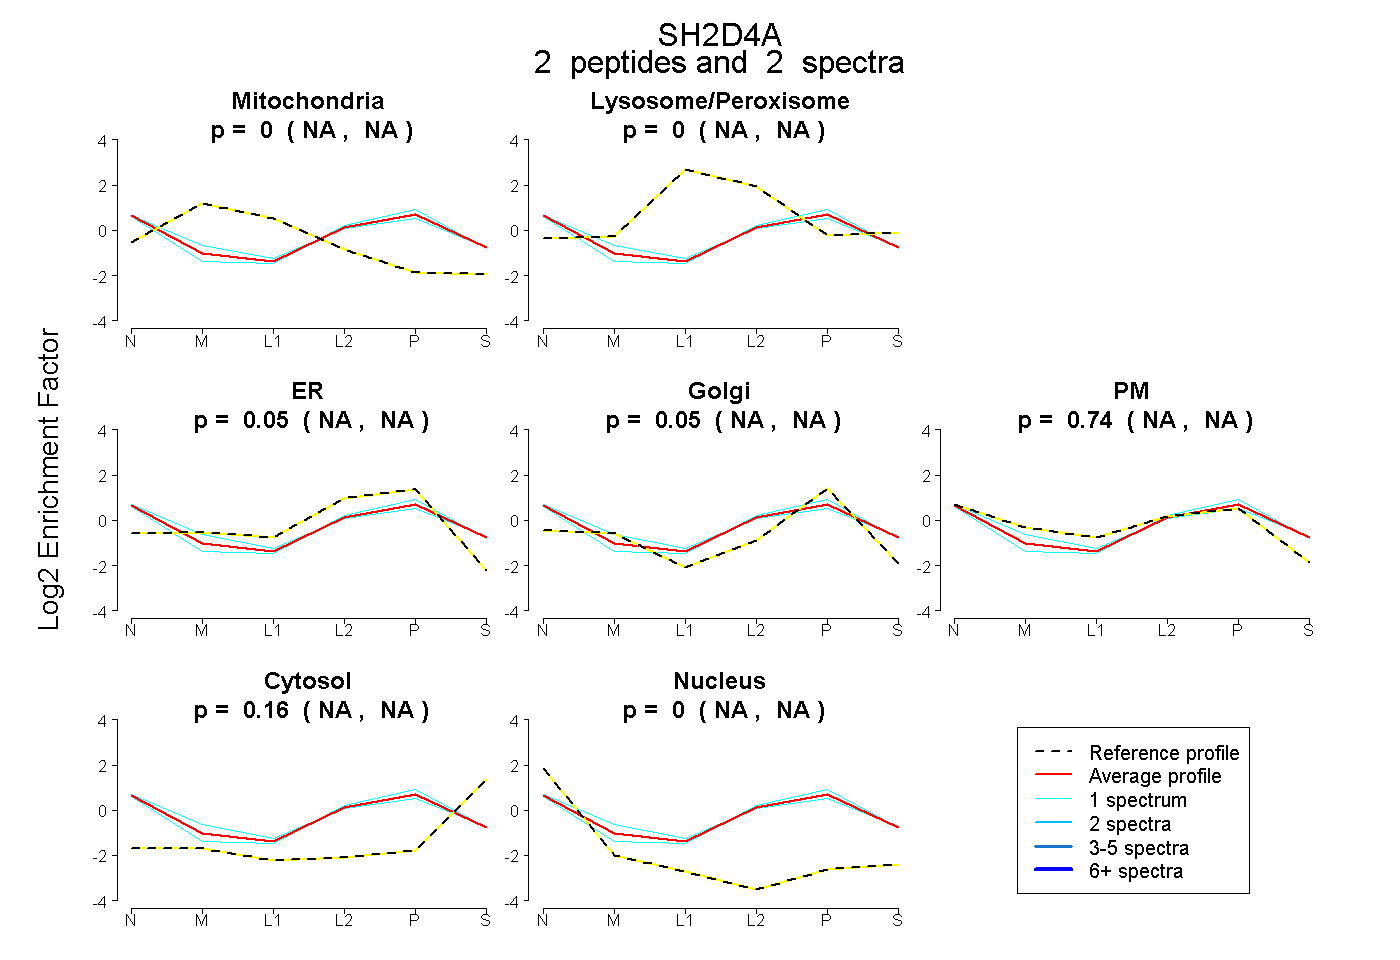 |
0.000 NA | NA |
0.000 NA | NA |
0.048 NA | NA |
0.046 NA | NA |
0.744 NA | NA |
0.163 NA | NA |
0.000 NA | NA |
|||
| Plot | Lyso | Other | |||||||||||
| Expt C |
4 peptides |
8 spectra |
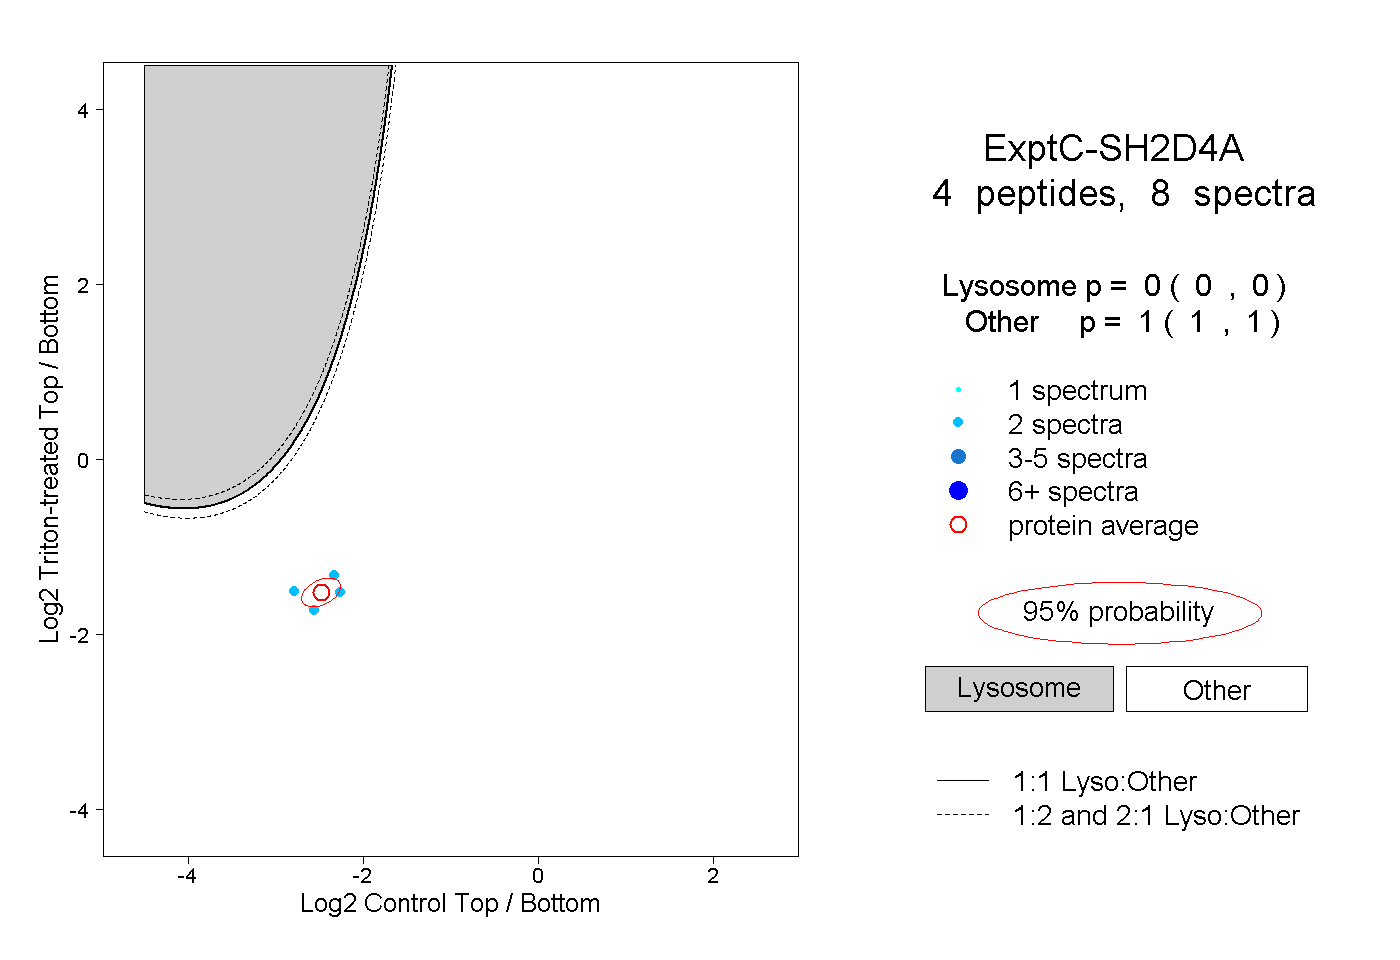 |
0.000 0.000 | 0.000 |
1.000 1.000 | 1.000 |
||||||||
| Plot | Lyso | Other | |||||||||||
| Expt D |
2 peptides |
6 spectra |
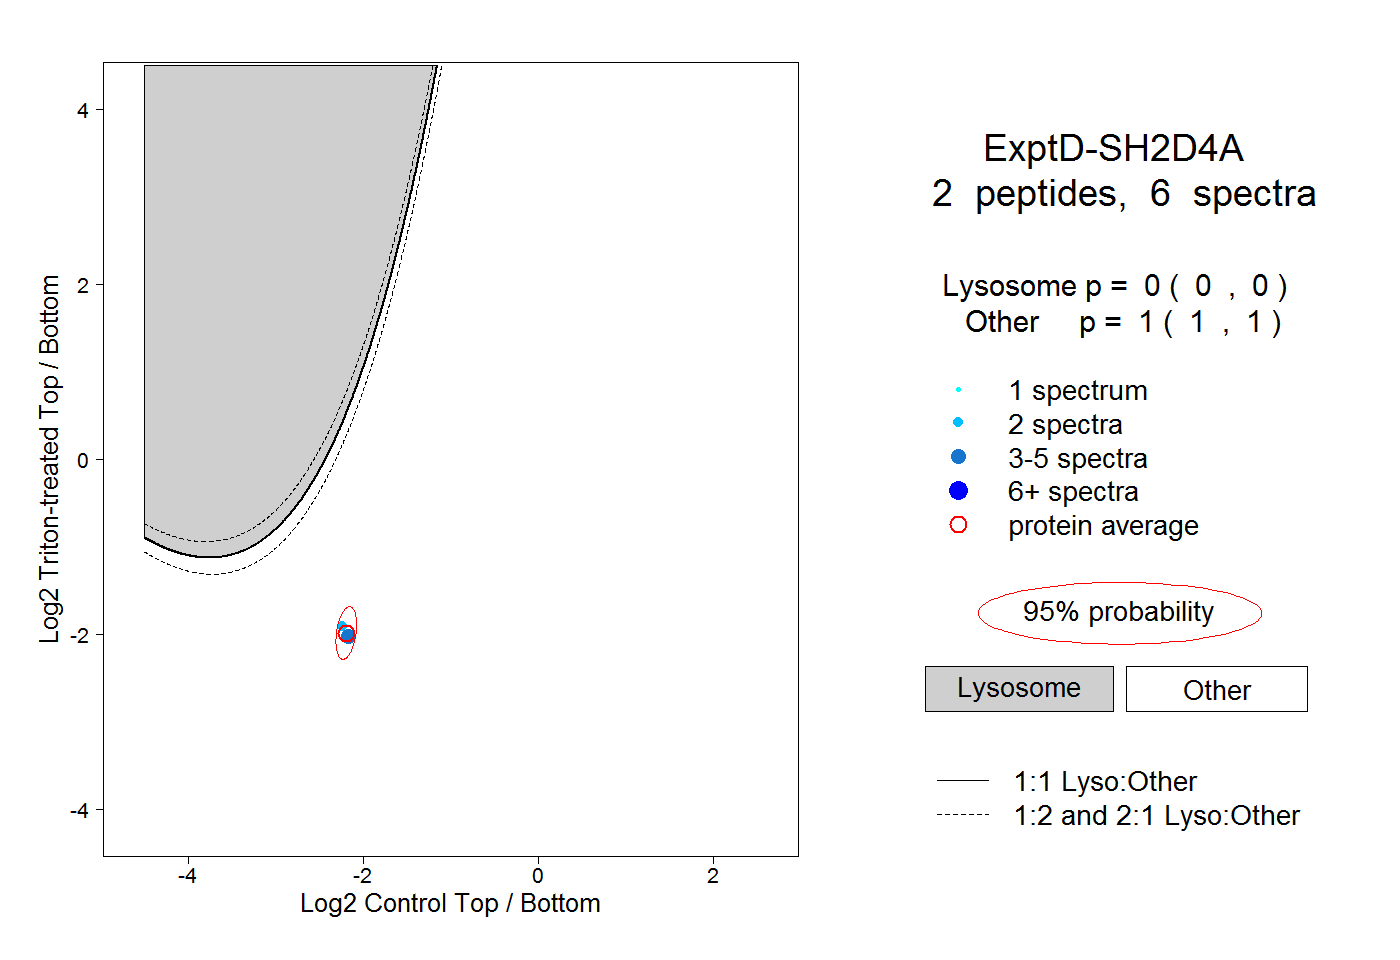 |
0.000 0.000 | 0.000 |
1.000 1.000 | 1.000 |