 9
9peptides
spectra
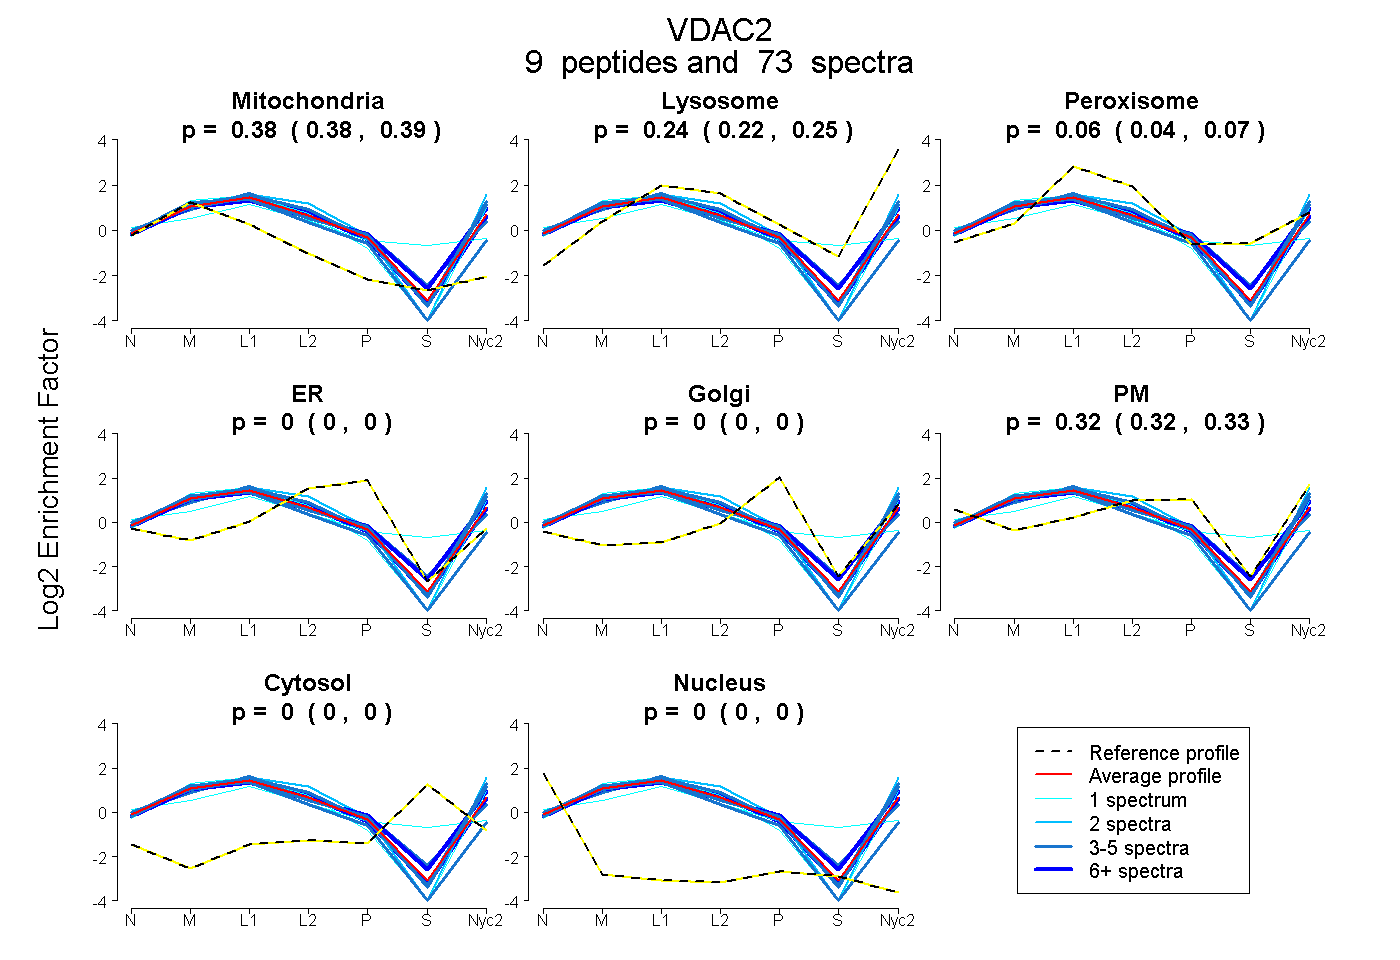
0.376 | 0.386
0.221 | 0.248
0.044 | 0.072
0.000 | 0.000
0.000 | 0.000
0.317 | 0.329
0.000 | 0.000
0.000 | 0.000
10peptides
spectra
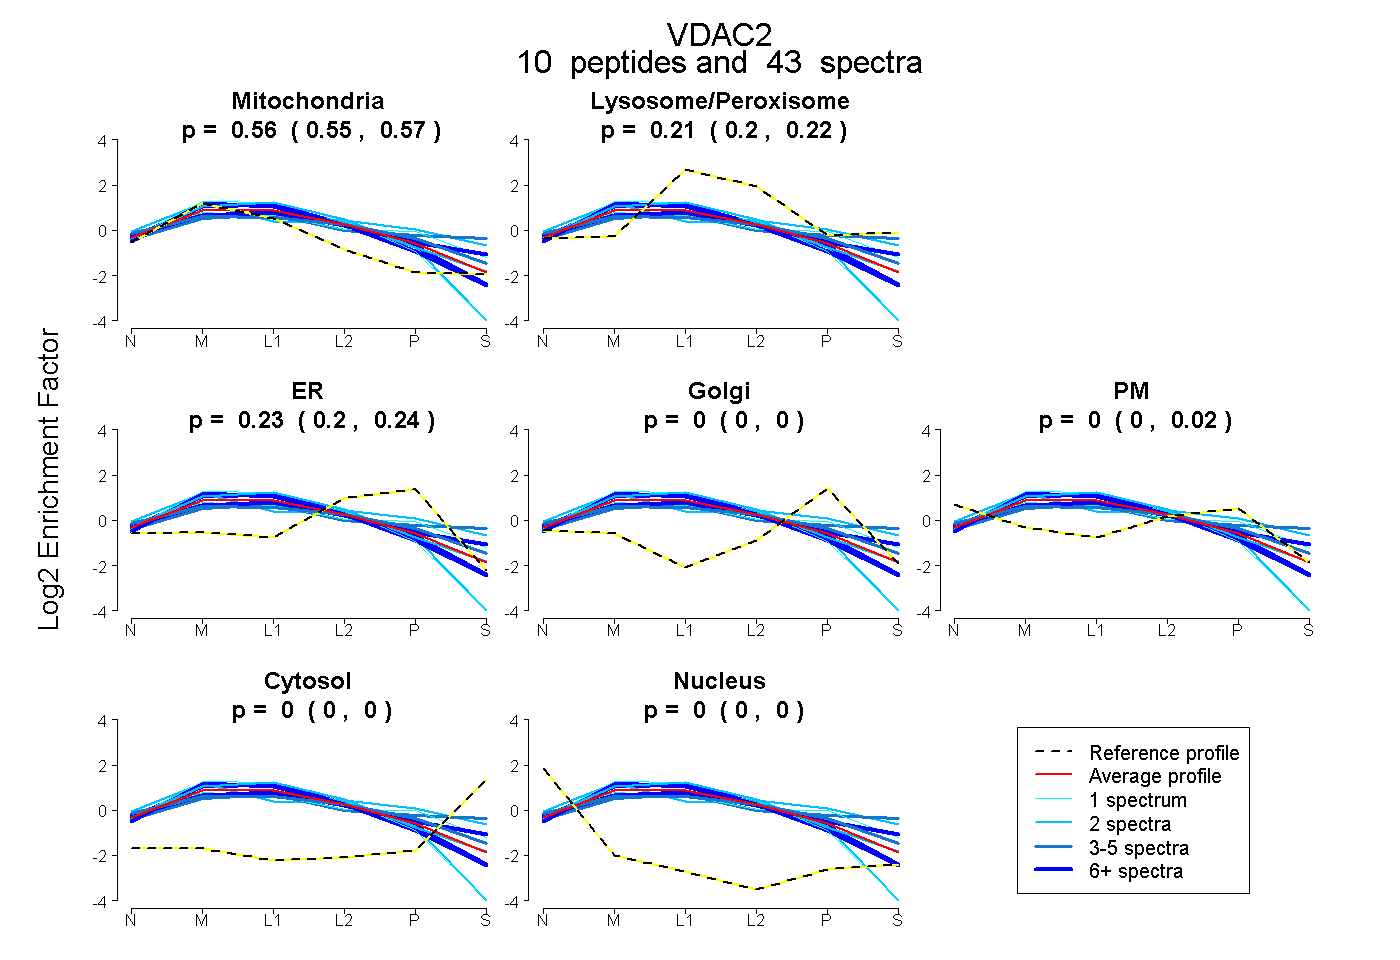
0.546 | 0.566
0.195 | 0.221
0.204 | 0.240
0.000 | 0.000
0.000 | 0.022
0.000 | 0.000
0.000 | 0.000
11peptides
spectra
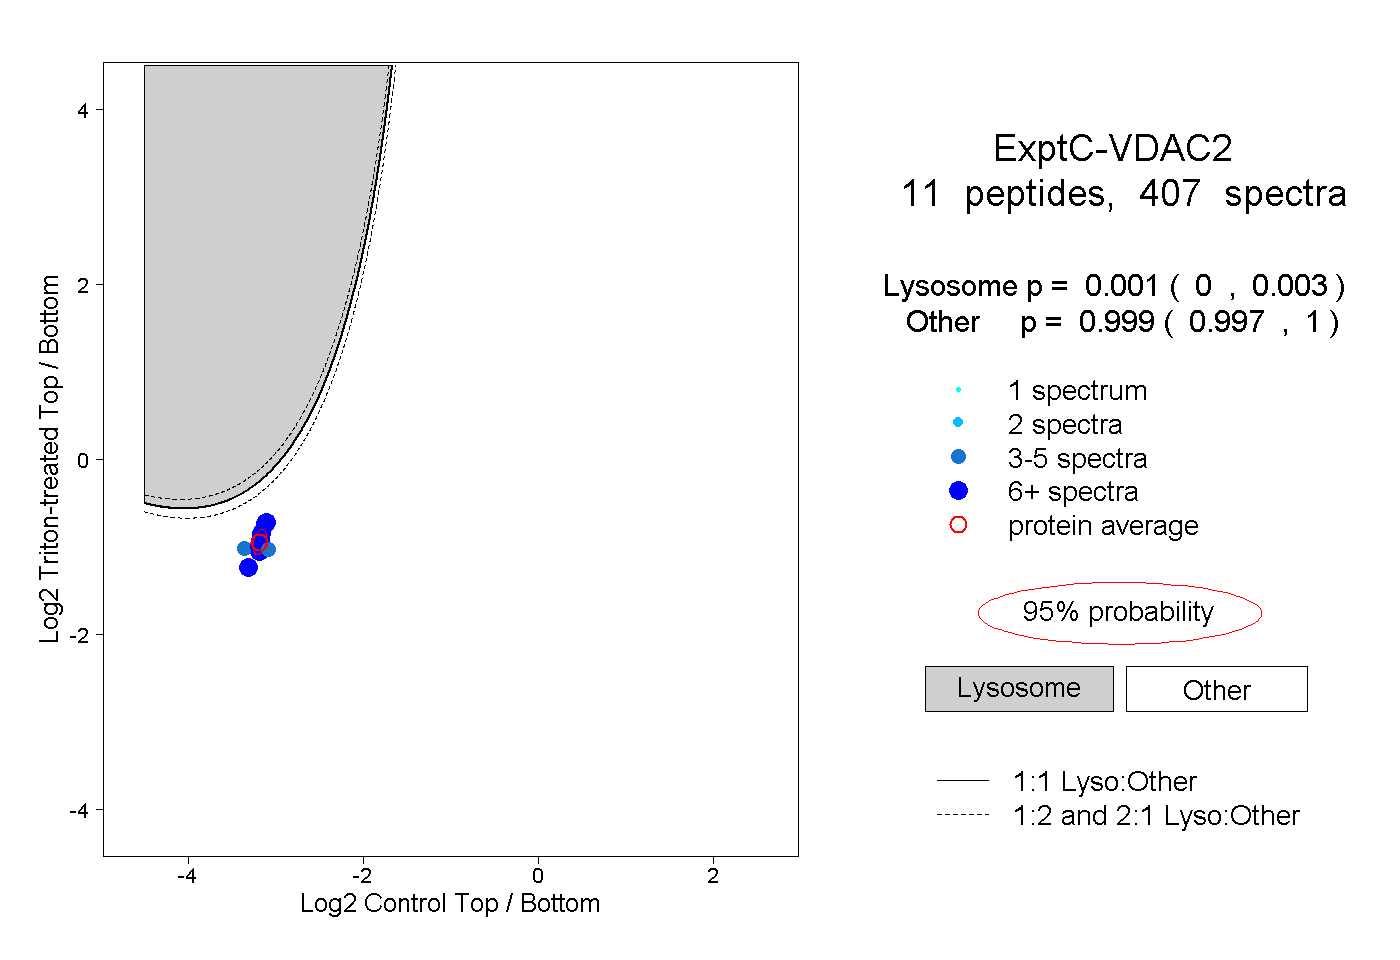
0.000 | 0.003
0.997 | 1.000
7peptides
spectra
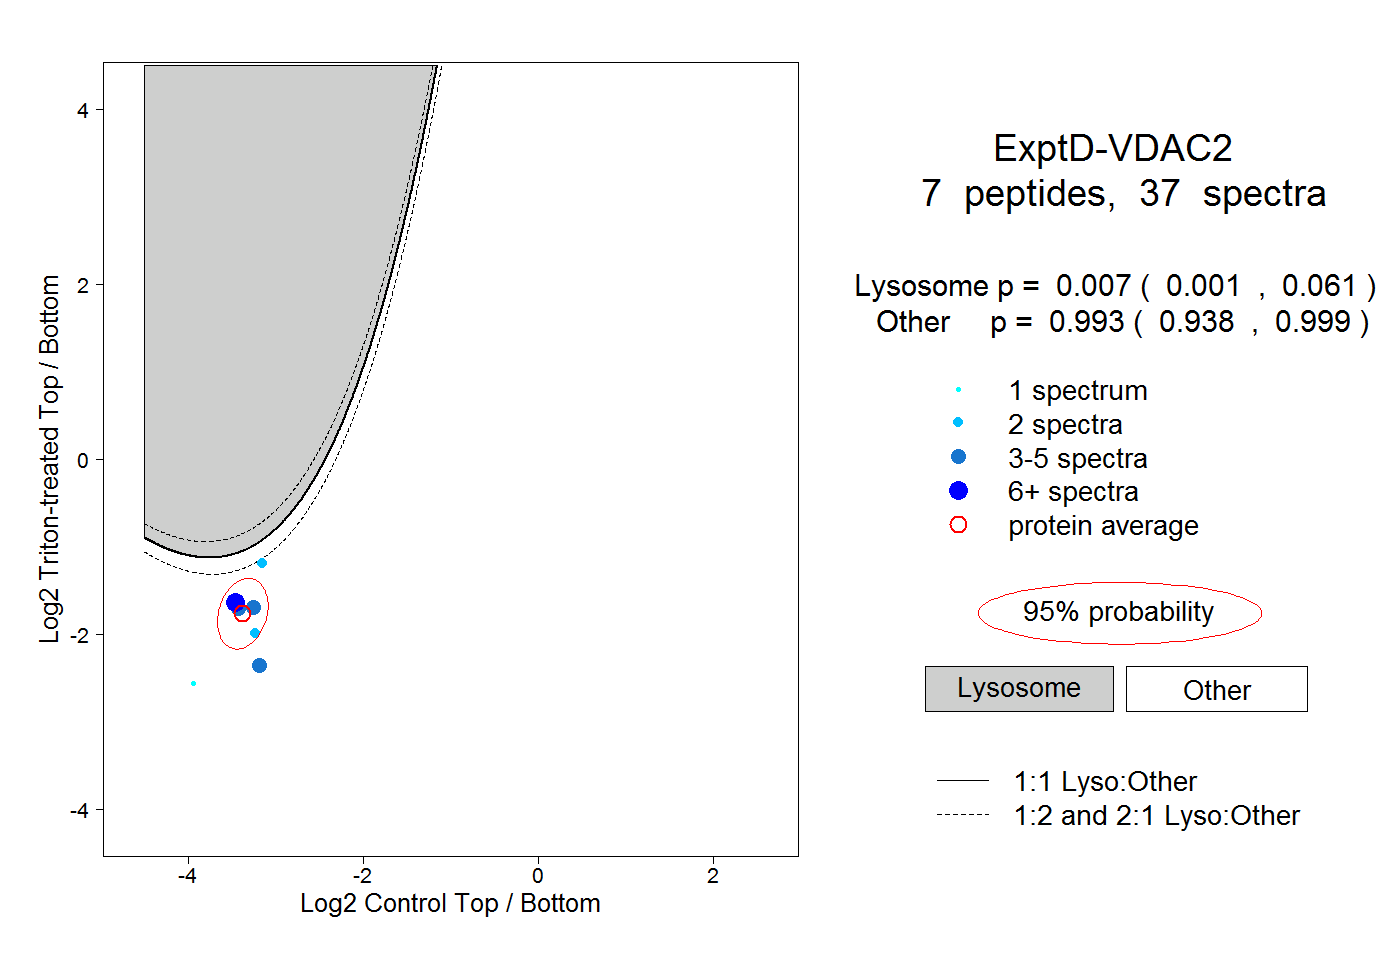
0.001 | 0.061
0.938 | 0.999