 9
9peptides
spectra
0.376 | 0.386
0.221 | 0.248
0.044 | 0.072
0.000 | 0.000
0.000 | 0.000
0.317 | 0.329
0.000 | 0.000
0.000 | 0.000
| Plot | Mito | Lyso | Perox | ER | Golgi | PM | Cytosol | Nucleus | |||||
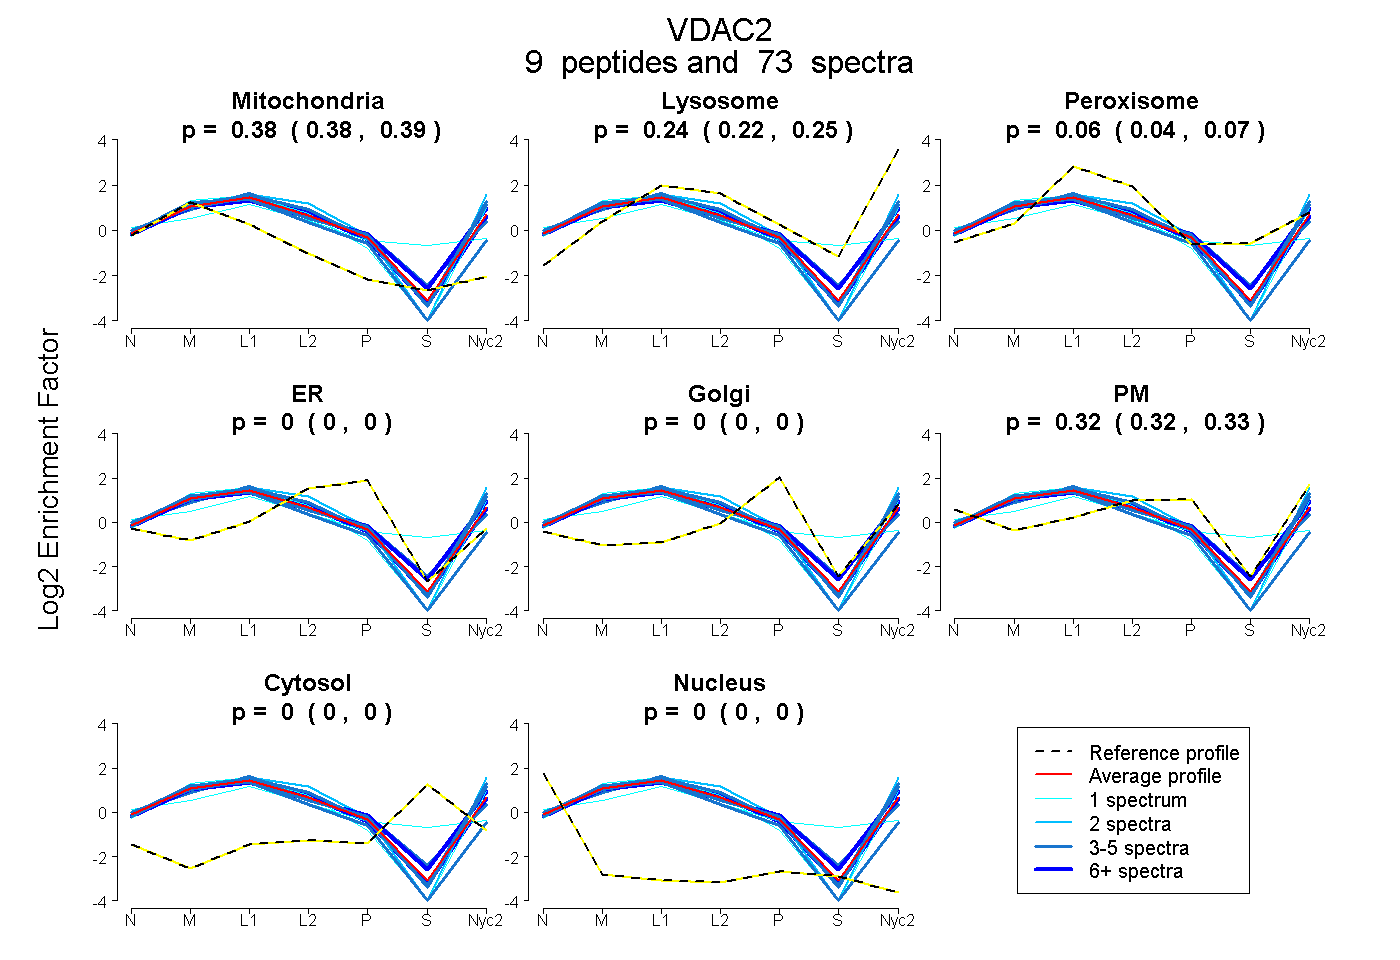
| Expt A |
9 peptides |
73 spectra |
|
0.381 0.376 | 0.386 |
0.236 0.221 | 0.248 |
0.059 0.044 | 0.072 |
0.000 0.000 | 0.000 |
0.000 0.000 | 0.000 |
0.324 0.317 | 0.329 |
0.000 0.000 | 0.000 |
0.000 0.000 | 0.000 |
| 1 spectrum, SCSGVEFSTSGSSNTDTGK | 0.277 | 0.000 | 0.458 | 0.014 | 0.031 | 0.102 | 0.117 | 0.000 | ||
| 19 spectra, GFGFGLVK | 0.398 | 0.231 | 0.064 | 0.000 | 0.000 | 0.307 | 0.000 | 0.000 | ||
| 4 spectra, WCEYGLTFTEK | 0.561 | 0.106 | 0.000 | 0.146 | 0.000 | 0.186 | 0.000 | 0.000 | ||
| 35 spectra, SNFAVGYR | 0.345 | 0.299 | 0.051 | 0.000 | 0.000 | 0.306 | 0.000 | 0.000 | ||
| 1 spectrum, VNNSSLIGVGYAQTLRPGVK | 0.442 | 0.322 | 0.000 | 0.000 | 0.000 | 0.236 | 0.000 | 0.000 | ||
| 5 spectra, SFNAGGHK | 0.317 | 0.076 | 0.279 | 0.000 | 0.000 | 0.328 | 0.000 | 0.000 | ||
| 3 spectra, YQLDPTASISAK | 0.338 | 0.274 | 0.000 | 0.000 | 0.000 | 0.389 | 0.000 | 0.000 | ||
| 3 spectra, VSGTLETK | 0.336 | 0.369 | 0.000 | 0.000 | 0.000 | 0.295 | 0.000 | 0.000 | ||
| 2 spectra, LTFDTTFSPNTGK | 0.272 | 0.339 | 0.000 | 0.000 | 0.000 | 0.389 | 0.000 | 0.000 |
| Plot | Mito | Lyso or Perox | ER | Golgi | PM | Cytosol | Nucleus | ||||||
| Expt B |
10 peptides |
43 spectra |
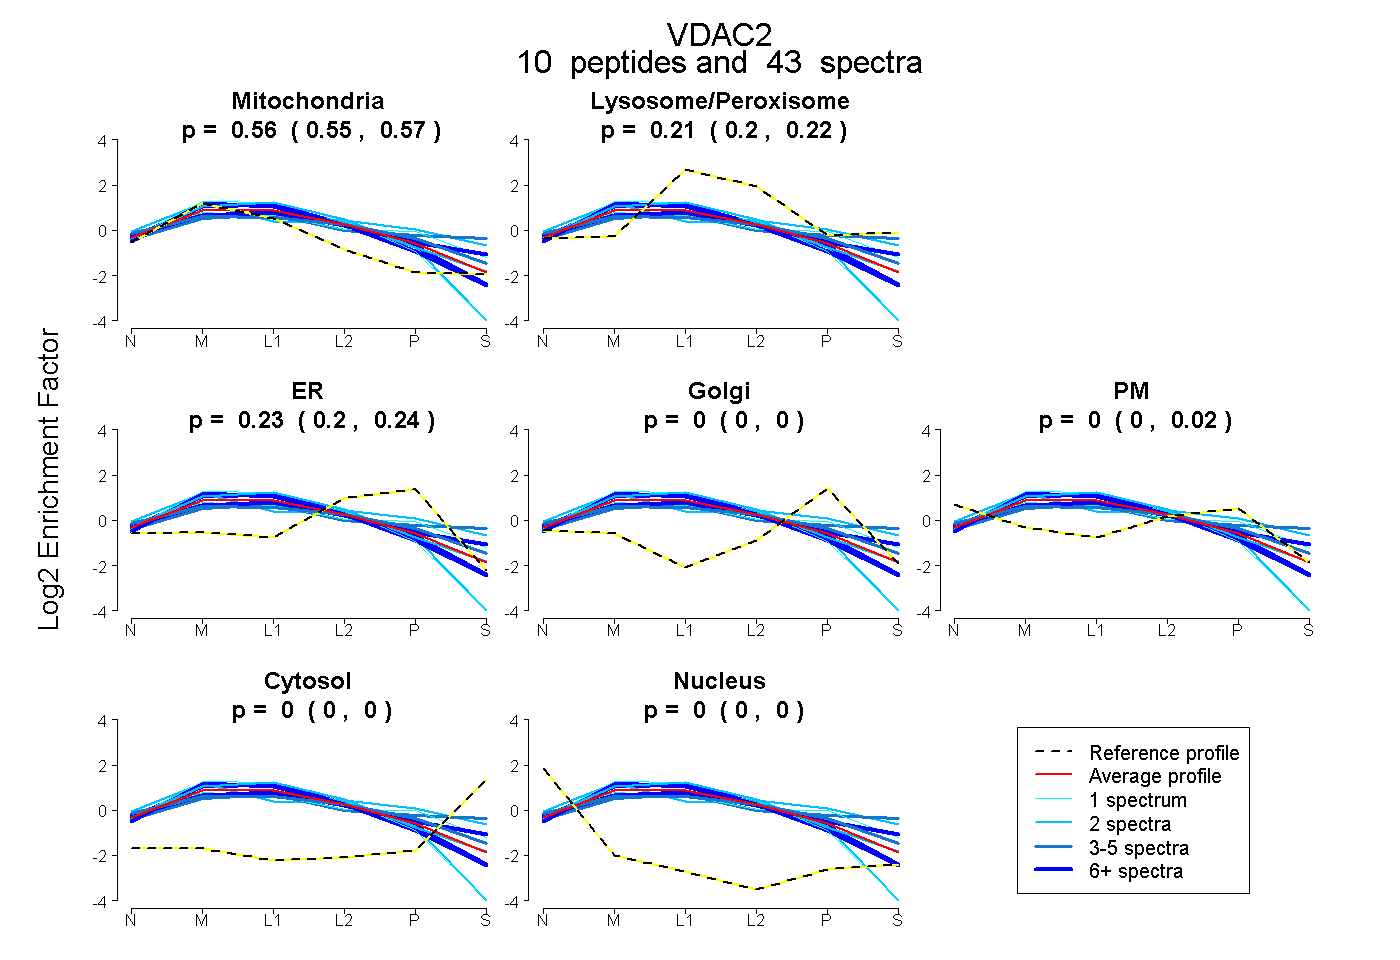 |
0.559 0.546 | 0.566 |
0.209 0.195 | 0.221 |
0.229 0.204 | 0.240 |
0.000 0.000 | 0.000 |
0.003 0.000 | 0.022 |
0.000 0.000 | 0.000 |
0.000 0.000 | 0.000 |
|||
| Plot | Lyso | Other | |||||||||||
| Expt C |
11 peptides |
407 spectra |
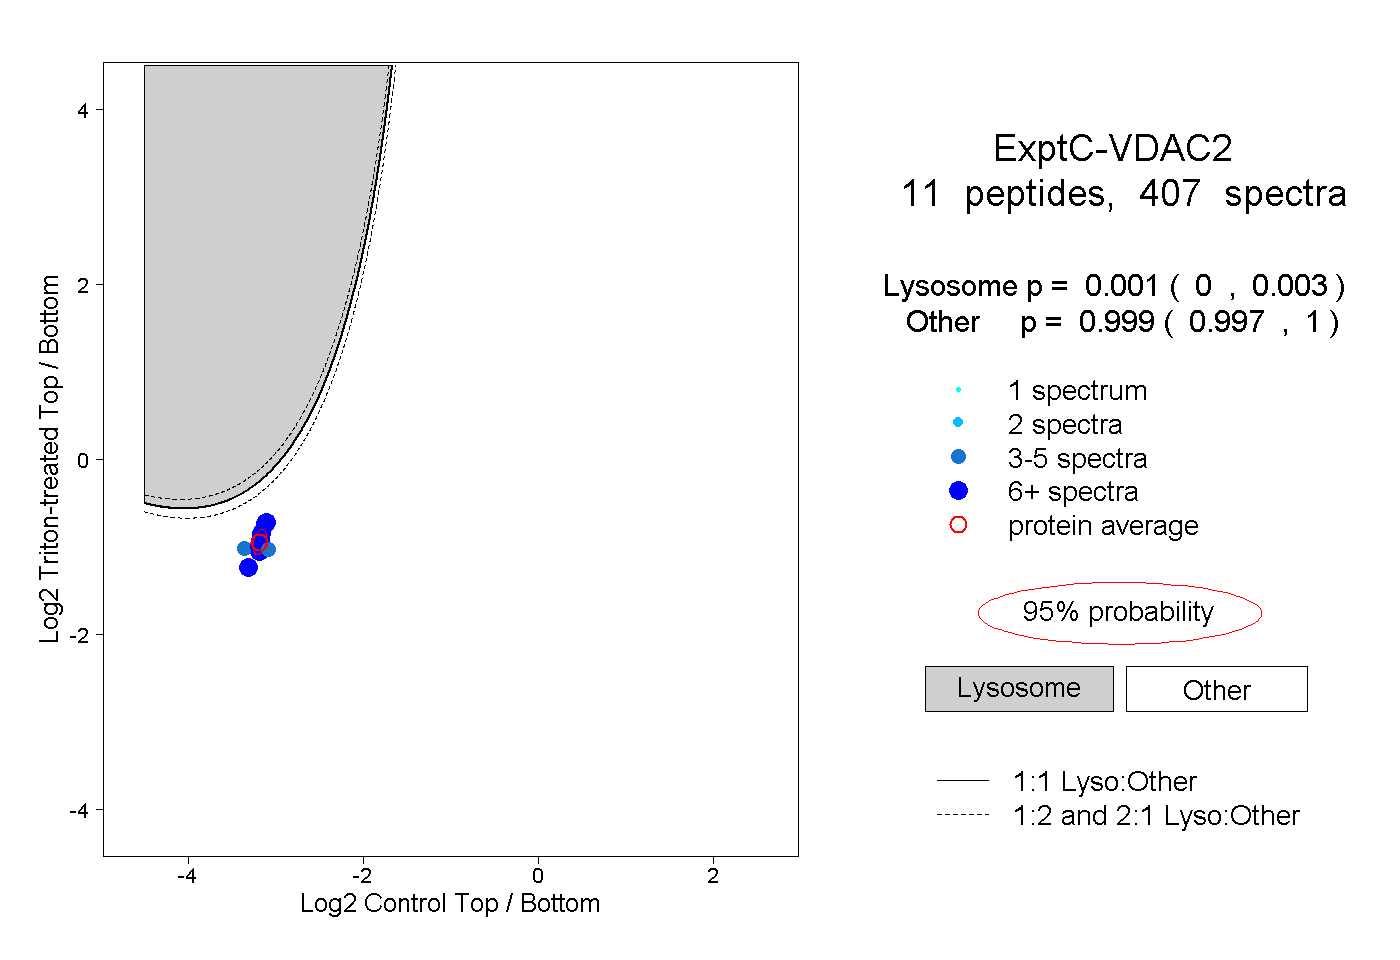 |
0.001 0.000 | 0.003 |
0.999 0.997 | 1.000 |
||||||||
| Plot | Lyso | Other | |||||||||||
| Expt D |
7 peptides |
37 spectra |
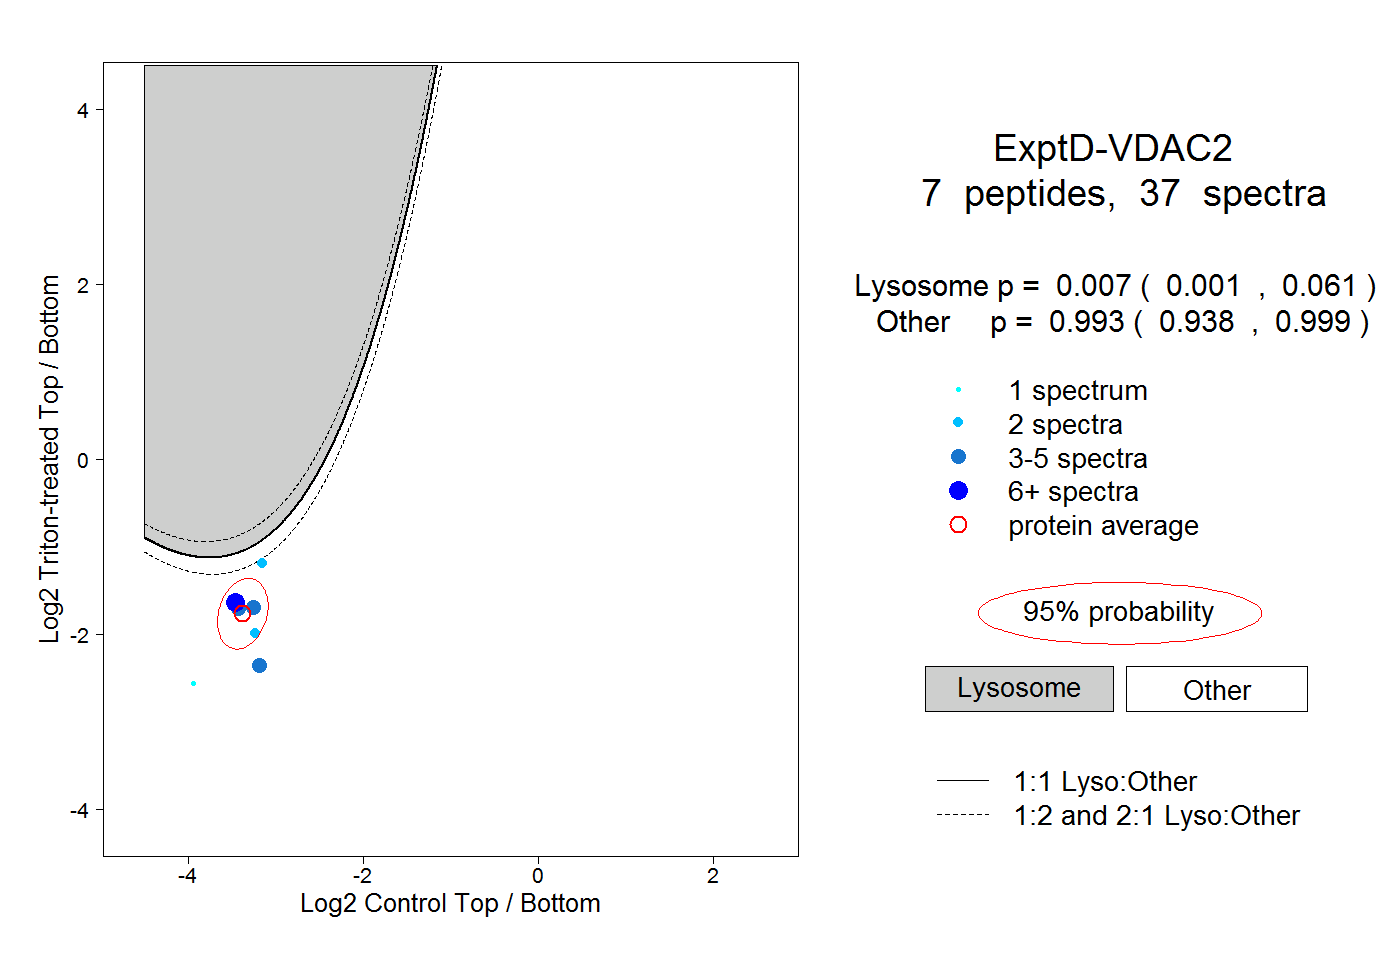 |
0.007 0.001 | 0.061 |
0.993 0.938 | 0.999 |