 4
4peptides
spectra
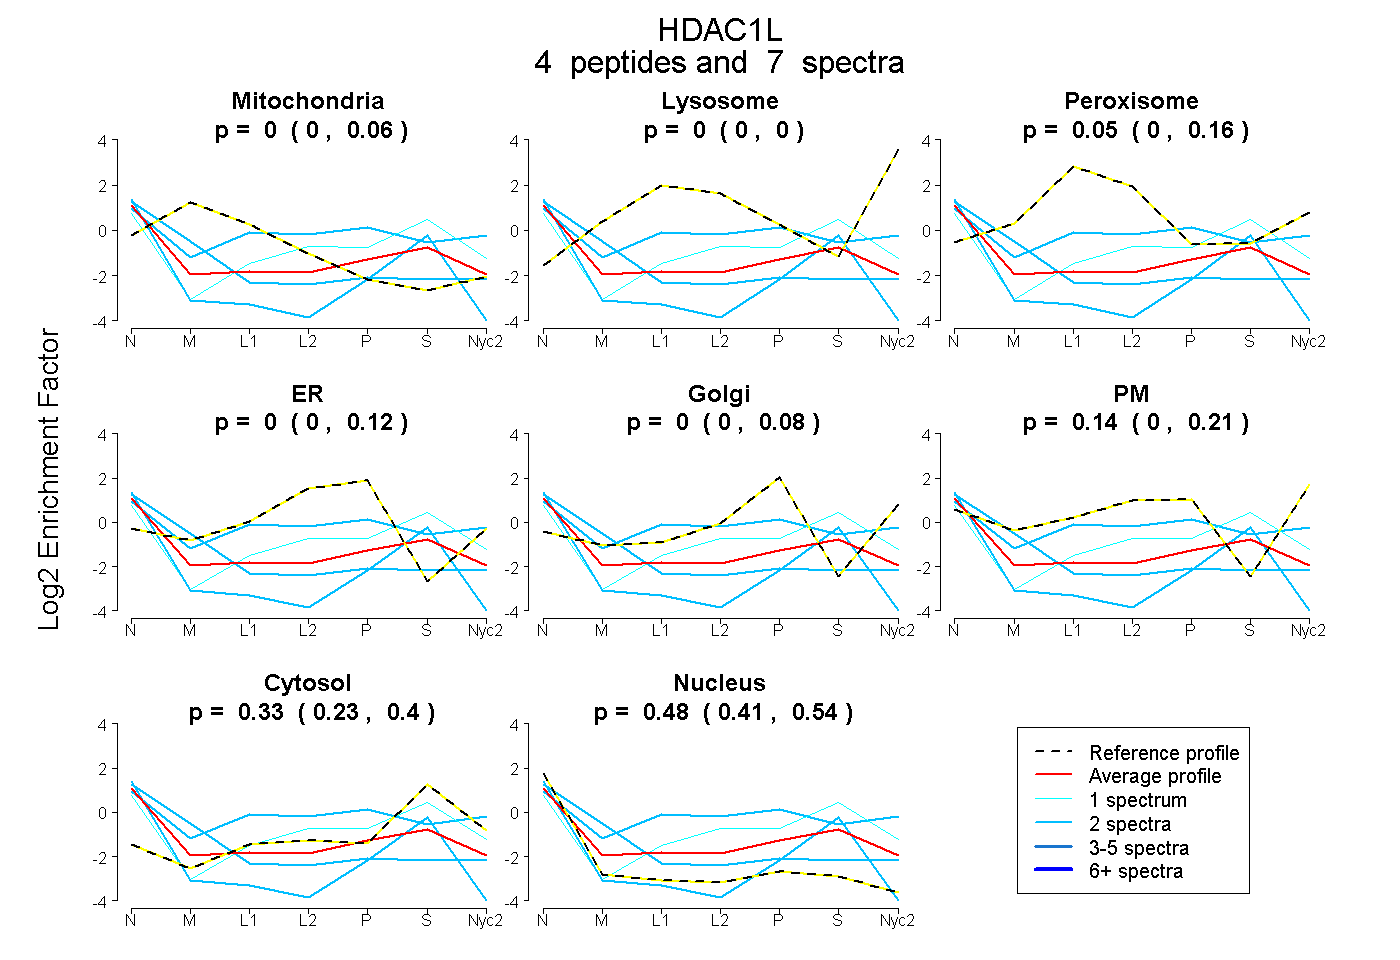
0.000 | 0.063
0.000 | 0.000
0.000 | 0.159
0.000 | 0.122
0.000 | 0.083
0.000 | 0.208
0.232 | 0.399
0.409 | 0.541
2peptides
spectra
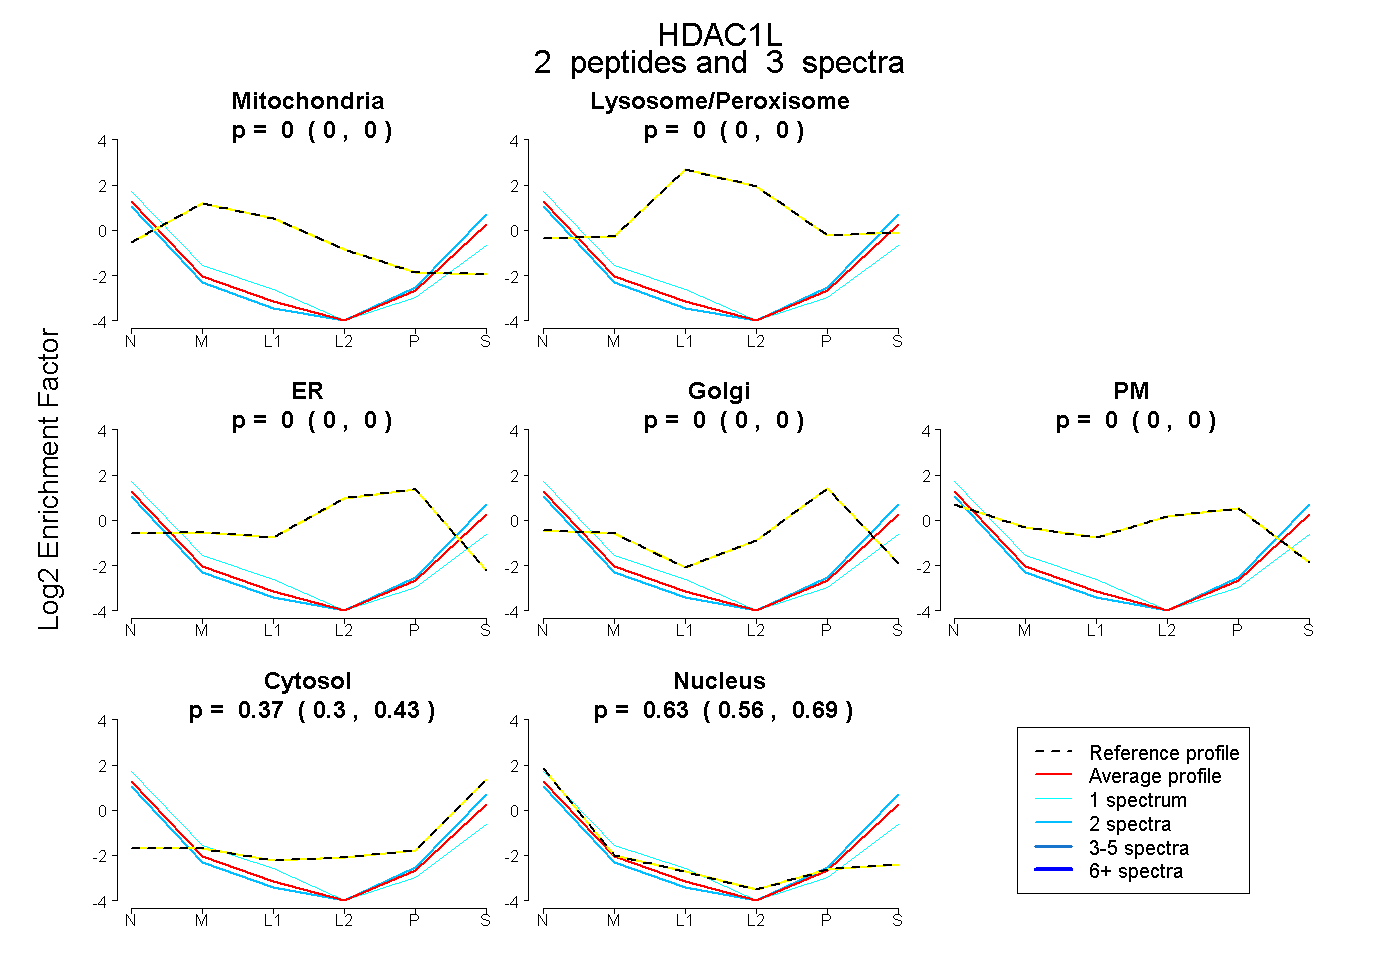
0.000 | 0.000
0.000 | 0.000
0.000 | 0.000
0.000 | 0.000
0.000 | 0.000
0.300 | 0.428
0.562 | 0.693