 4
4peptides
spectra
0.000 | 0.063
0.000 | 0.000
0.000 | 0.159
0.000 | 0.122
0.000 | 0.083
0.000 | 0.208
0.232 | 0.399
0.409 | 0.541
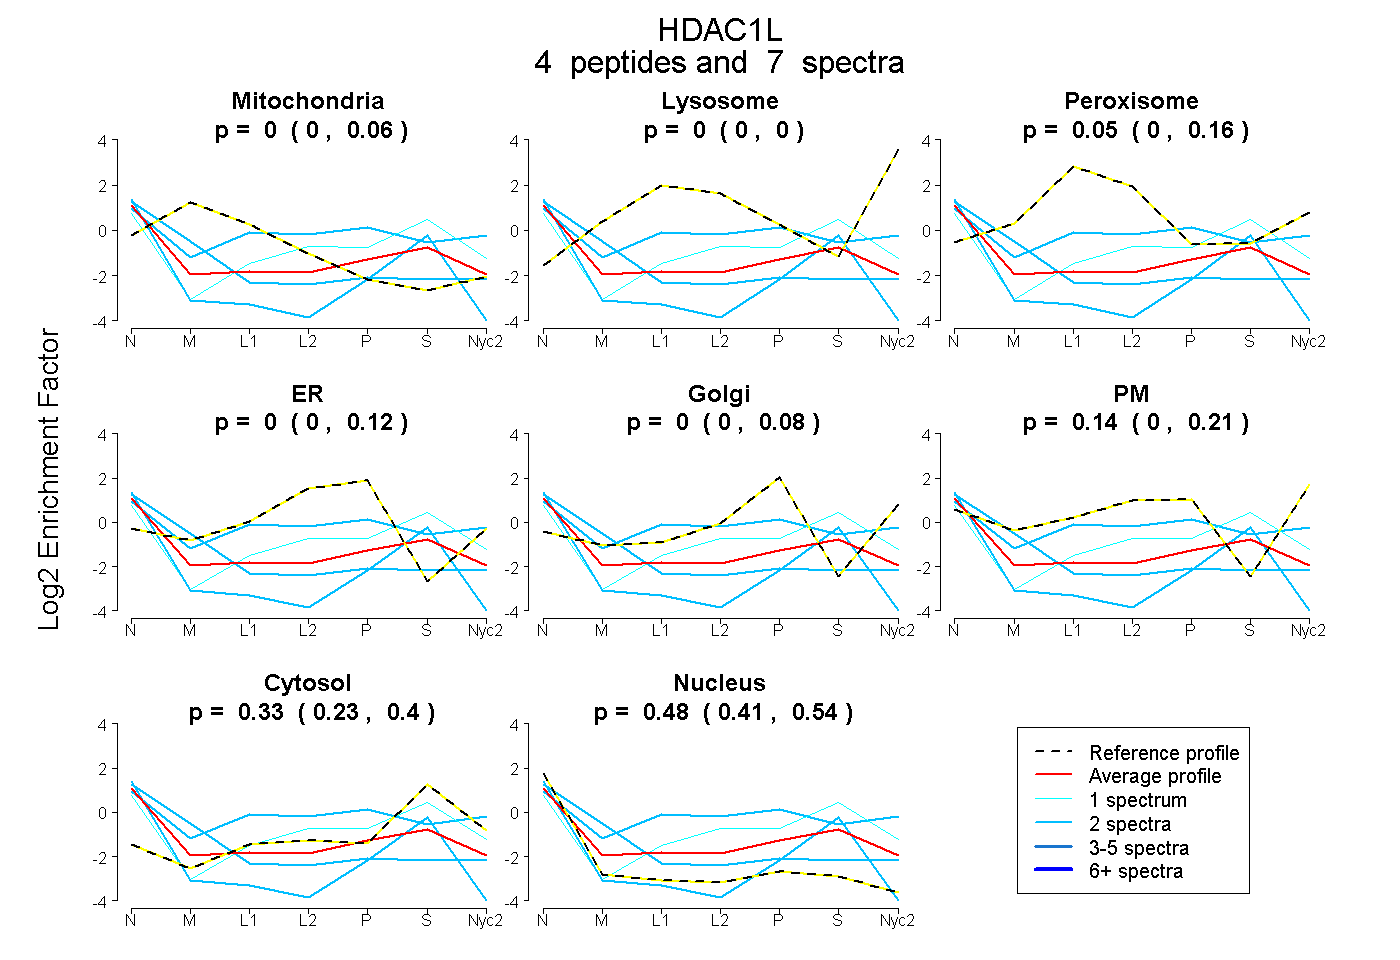
| Plot | Mito | Lyso | Perox | ER | Golgi | PM | Cytosol | Nucleus | |||||
| Expt A |
4 peptides |
7 spectra |
|
0.000 0.000 | 0.063 |
0.000 0.000 | 0.000 |
0.046 0.000 | 0.159 |
0.000 0.000 | 0.122 |
0.000 0.000 | 0.083 |
0.136 0.000 | 0.208 |
0.335 0.232 | 0.399 |
0.484 0.409 | 0.541 |
| 2 spectra, ANAEEMTK | 0.000 | 0.000 | 0.173 | 0.001 | 0.000 | 0.412 | 0.260 | 0.153 | ||
| 1 spectrum, YHSDDYIK | 0.000 | 0.000 | 0.000 | 0.074 | 0.000 | 0.101 | 0.619 | 0.206 | ||
| 2 spectra, YYAVNYPLR | 0.000 | 0.000 | 0.000 | 0.000 | 0.000 | 0.000 | 0.234 | 0.766 | ||
| 2 spectra, LGCFNLTIK | 0.328 | 0.000 | 0.000 | 0.000 | 0.000 | 0.085 | 0.045 | 0.543 |
| Plot | Mito | Lyso or Perox | ER | Golgi | PM | Cytosol | Nucleus | ||||||
| Expt B |
2 peptides |
3 spectra |
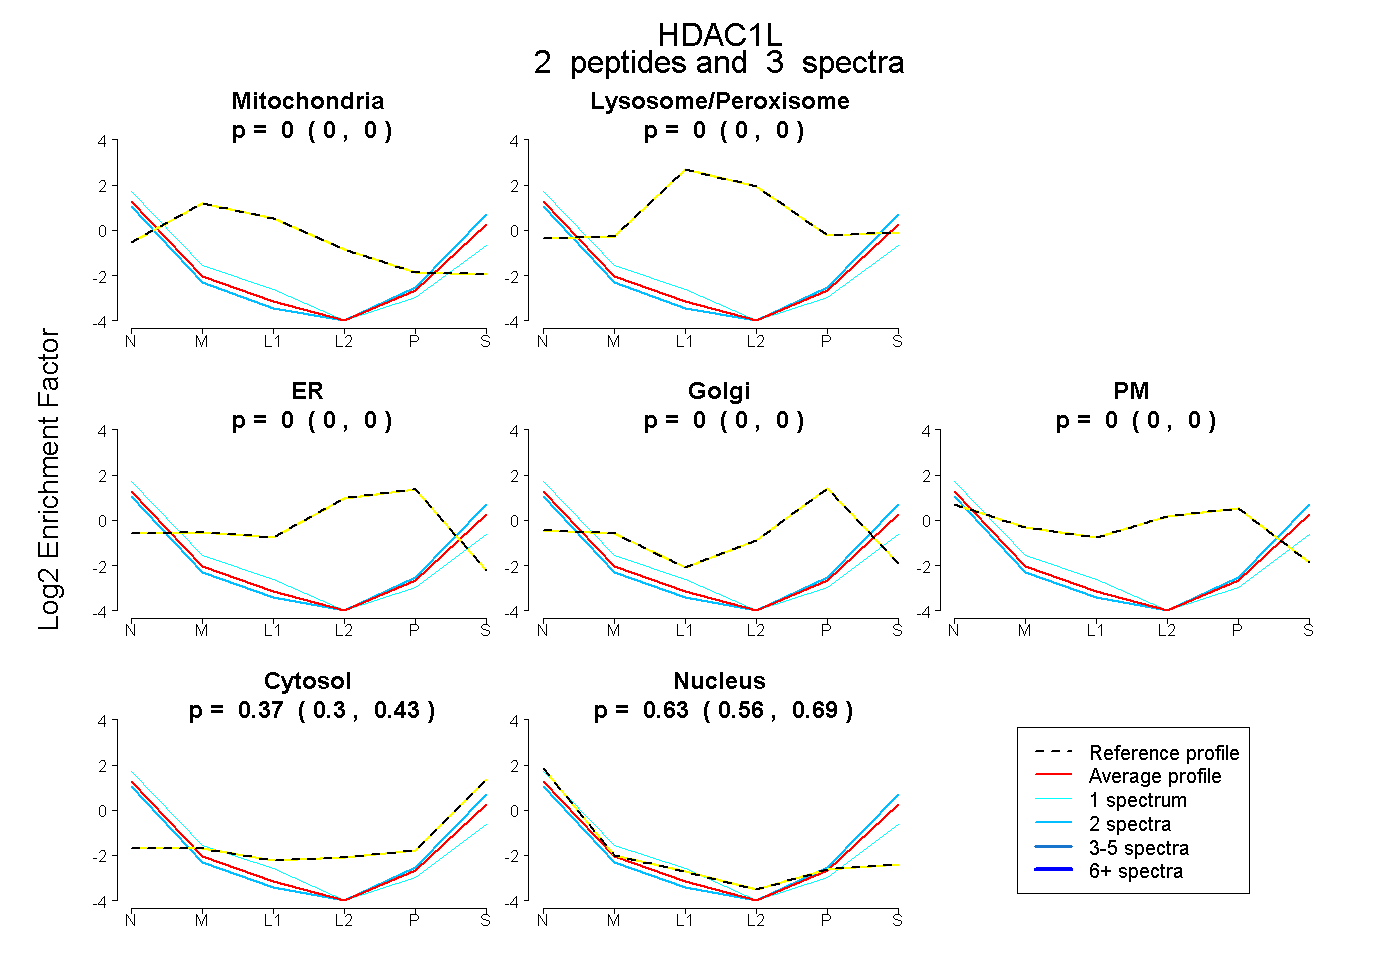 |
0.000 0.000 | 0.000 |
0.000 0.000 | 0.000 |
0.000 0.000 | 0.000 |
0.000 0.000 | 0.000 |
0.000 0.000 | 0.000 |
0.369 0.300 | 0.428 |
0.631 0.562 | 0.693 |