 5
5peptides
spectra
0.000 | 0.000
0.000 | 0.000
0.000 | 0.000
0.382 | 0.445
0.000 | 0.001
0.000 | 0.000
0.052 | 0.148
0.424 | 0.512
1peptide
spectra
NA | NA
NA | NA
| Plot | Mito | Lyso | Perox | ER | Golgi | PM | Cytosol | Nucleus | |||||
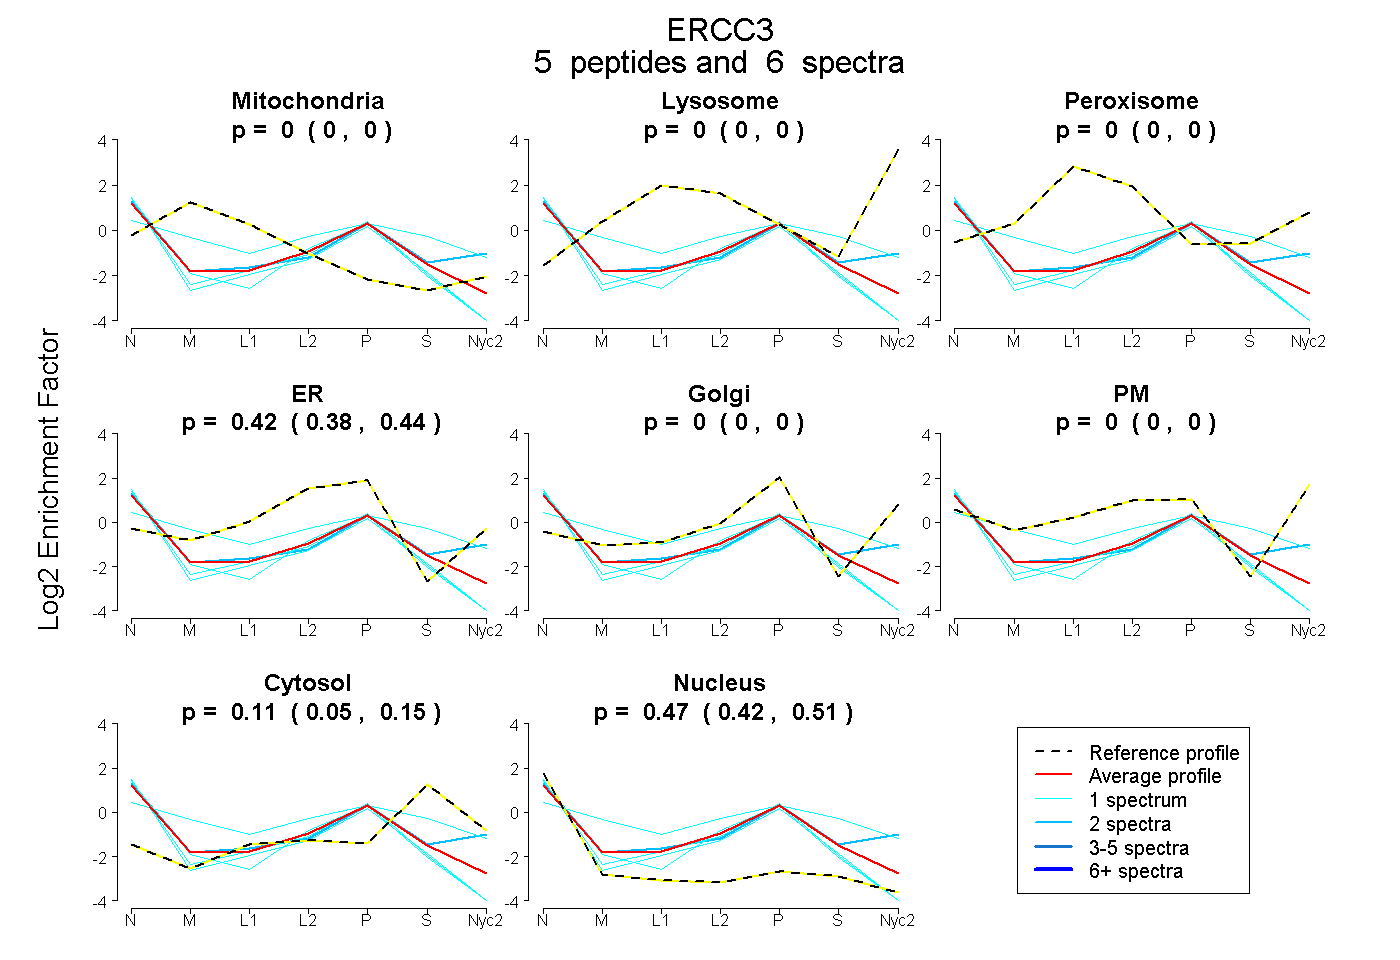
| Expt A |
5 peptides |
6 spectra |
|
0.000 0.000 | 0.000 |
0.000 0.000 | 0.000 |
0.000 0.000 | 0.000 |
0.421 0.382 | 0.445 |
0.000 0.000 | 0.001 |
0.000 0.000 | 0.000 |
0.106 0.052 | 0.148 |
0.473 0.424 | 0.512 |
||
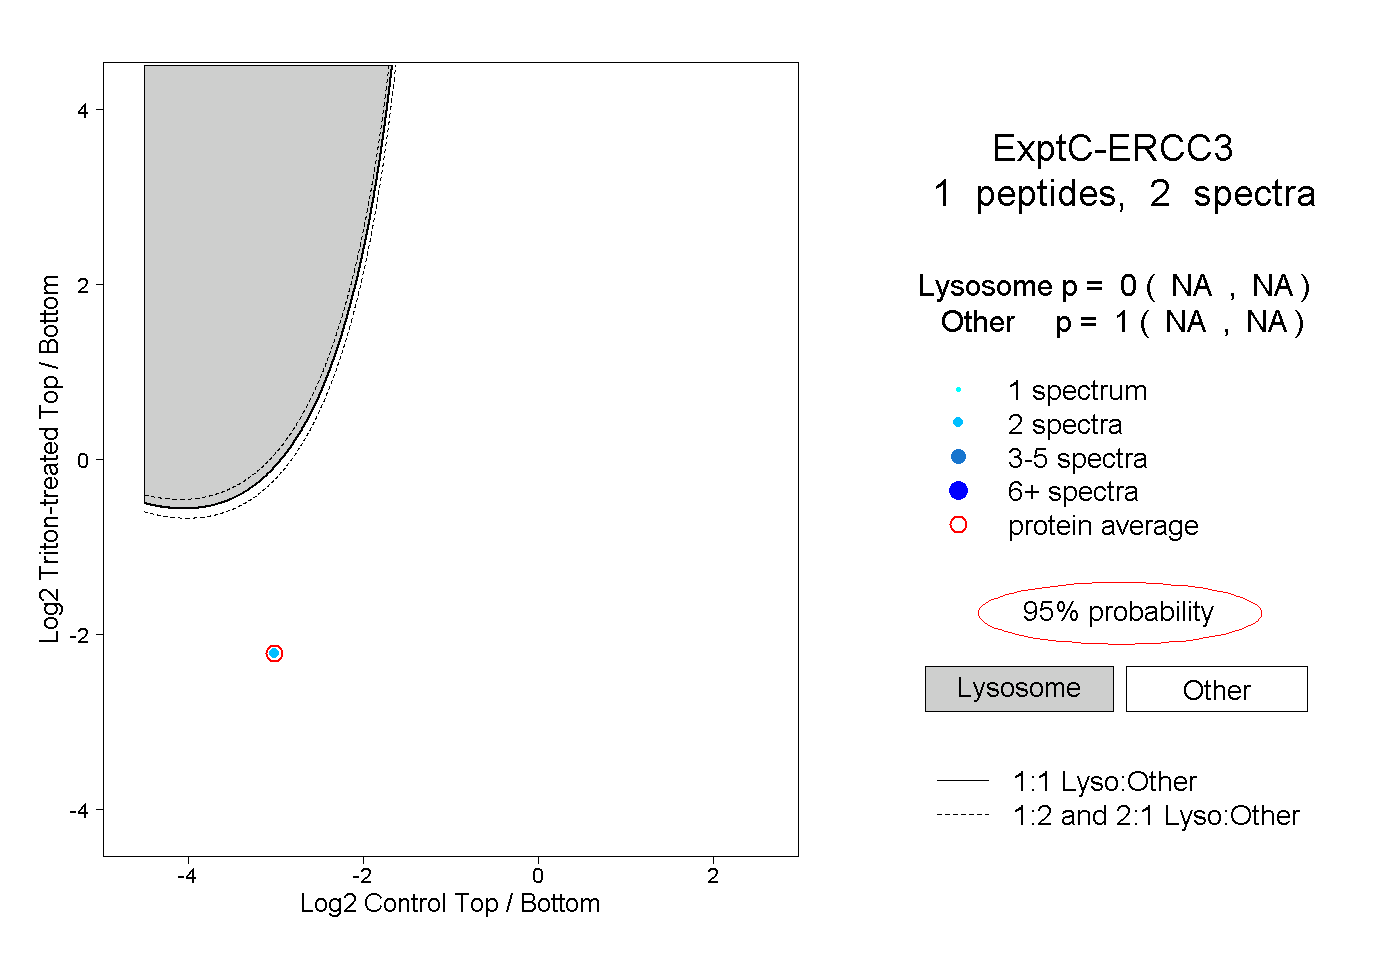
| Plot | Lyso | Other | |||||||||||
| Expt C |
1 peptide |
2 spectra |
|
0.000 NA | NA |
1.000 NA | NA |