 5
5peptides
spectra
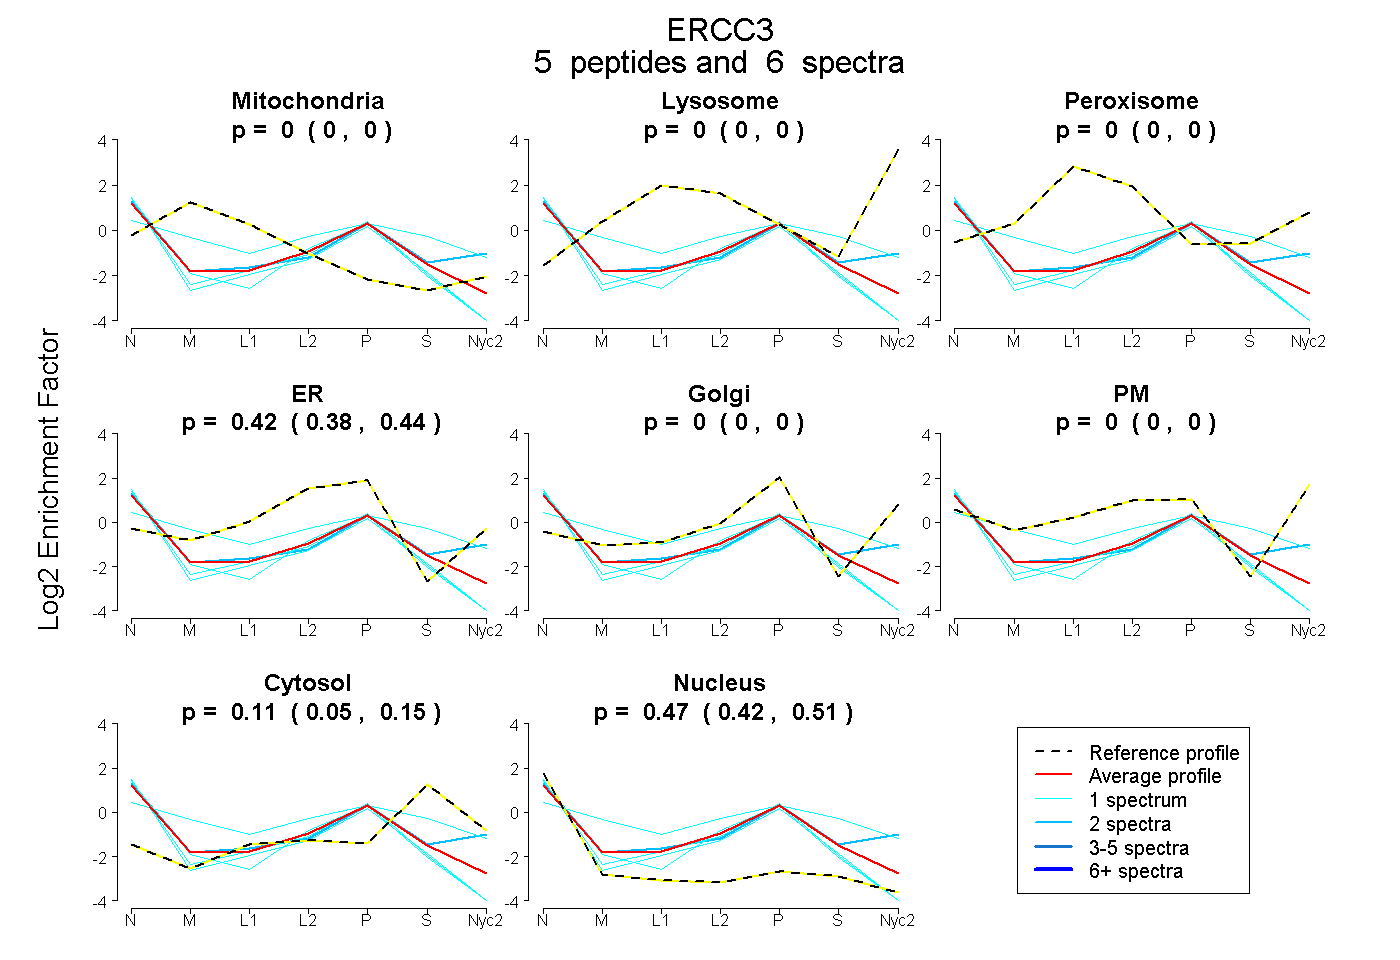
0.000 | 0.000
0.000 | 0.000
0.000 | 0.000
0.382 | 0.445
0.000 | 0.001
0.000 | 0.000
0.052 | 0.148
0.424 | 0.512
| Plot | Mito | Lyso | Perox | ER | Golgi | PM | Cytosol | Nucleus | |||||
| Expt A |
5 peptides |
6 spectra |
|
0.000 0.000 | 0.000 |
0.000 0.000 | 0.000 |
0.000 0.000 | 0.000 |
0.421 0.382 | 0.445 |
0.000 0.000 | 0.001 |
0.000 0.000 | 0.000 |
0.106 0.052 | 0.148 |
0.473 0.424 | 0.512 |
| 2 spectra, IIVFADNVFALK | 0.000 | 0.000 | 0.000 | 0.000 | 0.339 | 0.167 | 0.134 | 0.360 | ||
| 1 spectrum, SLVGVTAACTVR | 0.000 | 0.000 | 0.000 | 0.392 | 0.000 | 0.000 | 0.000 | 0.608 | ||
| 1 spectrum, LNKPYIYGPTSQGER | 0.000 | 0.000 | 0.000 | 0.345 | 0.000 | 0.000 | 0.007 | 0.648 | ||
| 1 spectrum, LGLTATLVR | 0.000 | 0.000 | 0.000 | 0.381 | 0.000 | 0.000 | 0.000 | 0.619 | ||
| 1 spectrum, QEMIEELQK | 0.168 | 0.000 | 0.000 | 0.323 | 0.000 | 0.087 | 0.367 | 0.055 |
| Plot | Lyso | Other | |||||||||||
| Expt C |
1 peptide |
2 spectra |
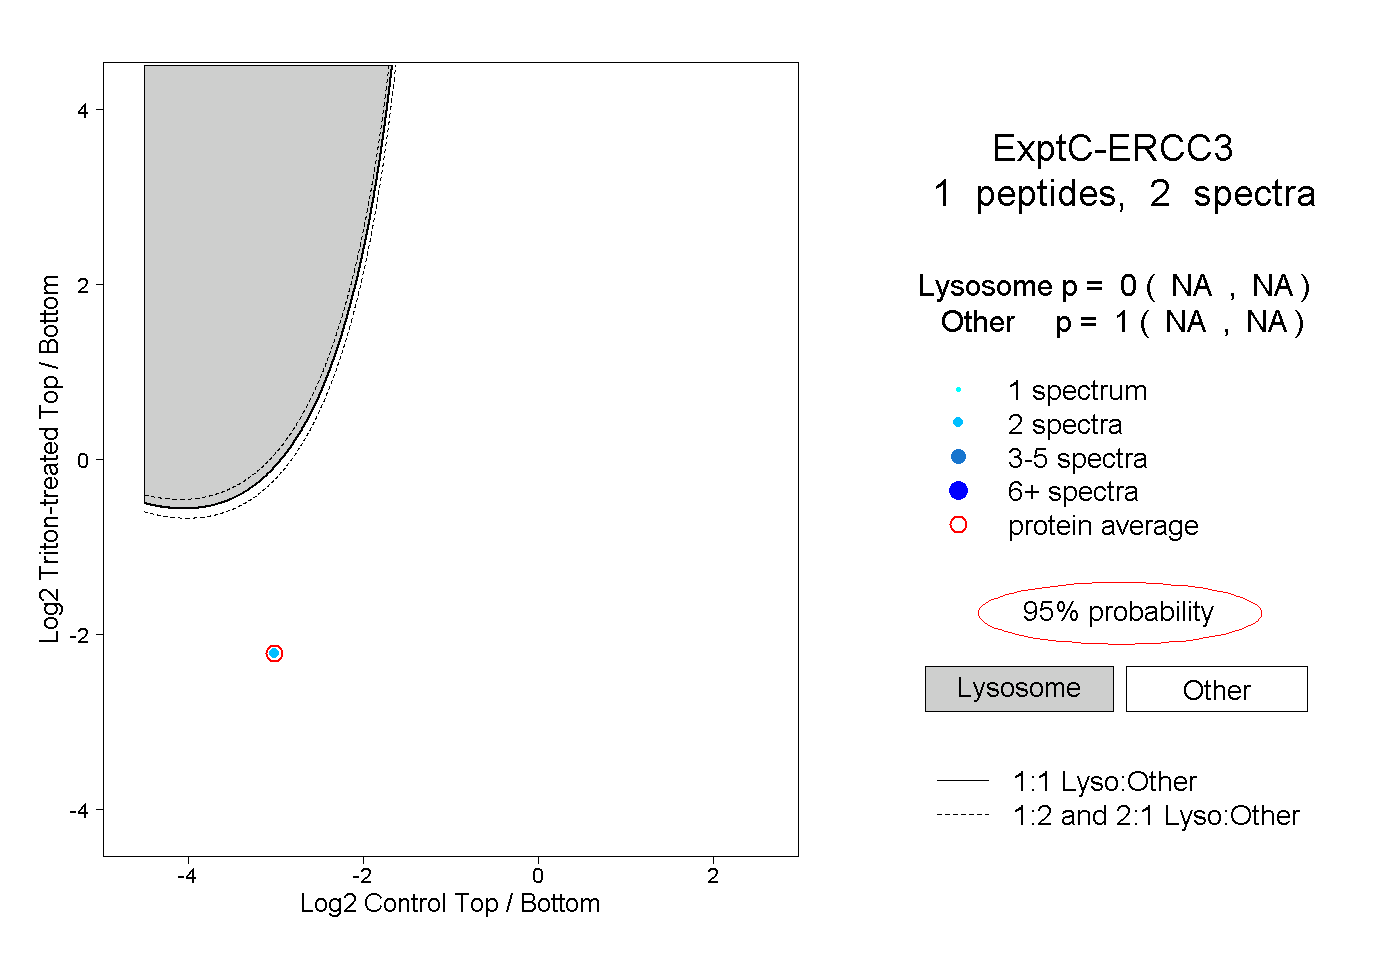 |
0.000 NA | NA |
1.000 NA | NA |