 3
3peptides
spectra
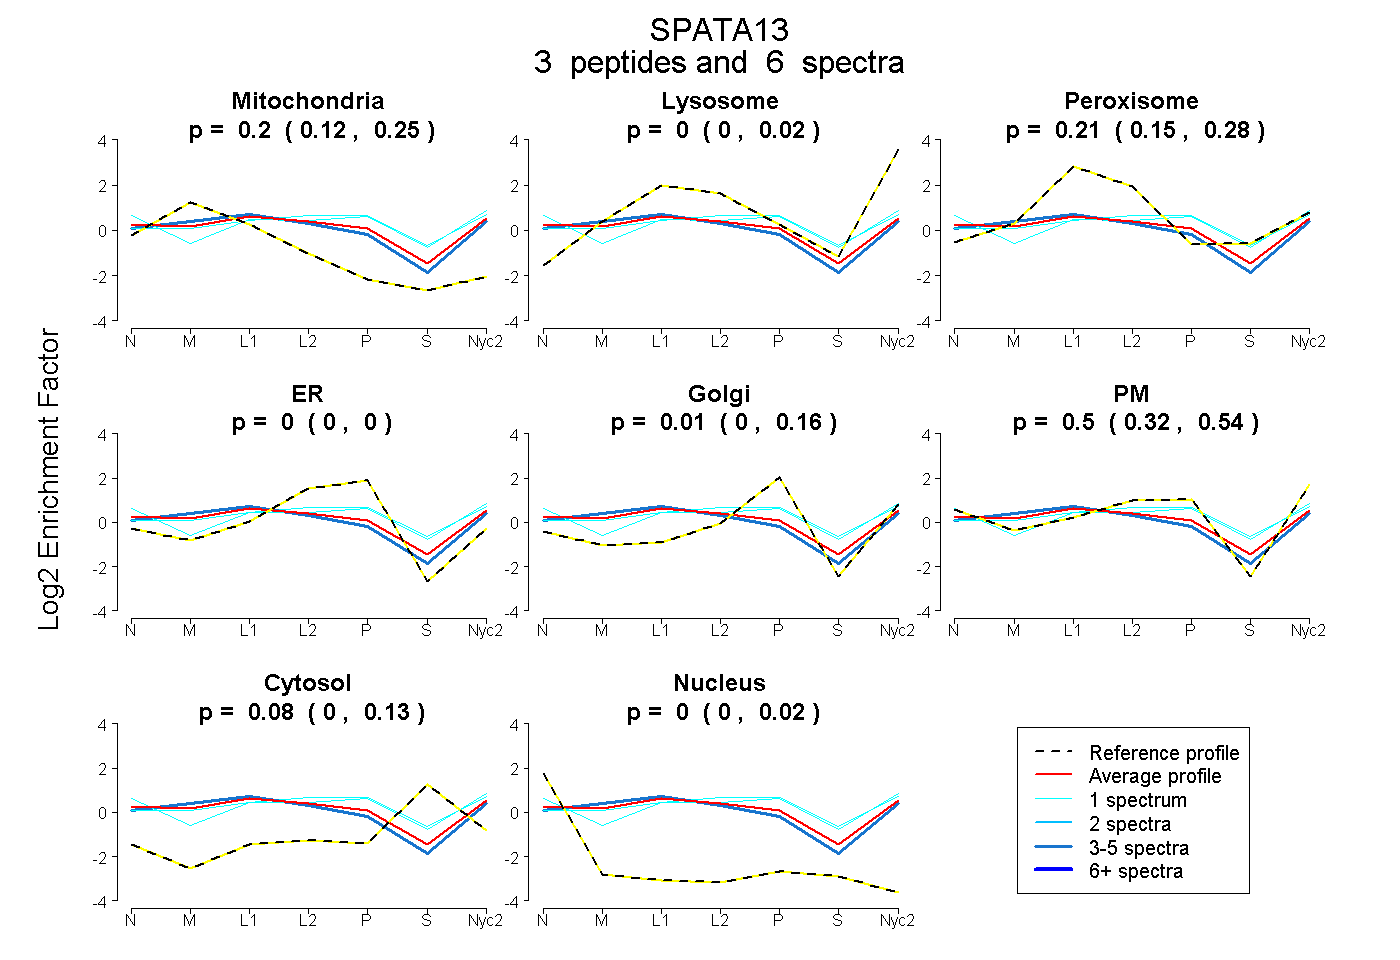
0.124 | 0.253
0.000 | 0.023
0.155 | 0.277
0.000 | 0.000
0.000 | 0.162
0.324 | 0.542
0.000 | 0.132
0.000 | 0.020
1peptide
spectrum
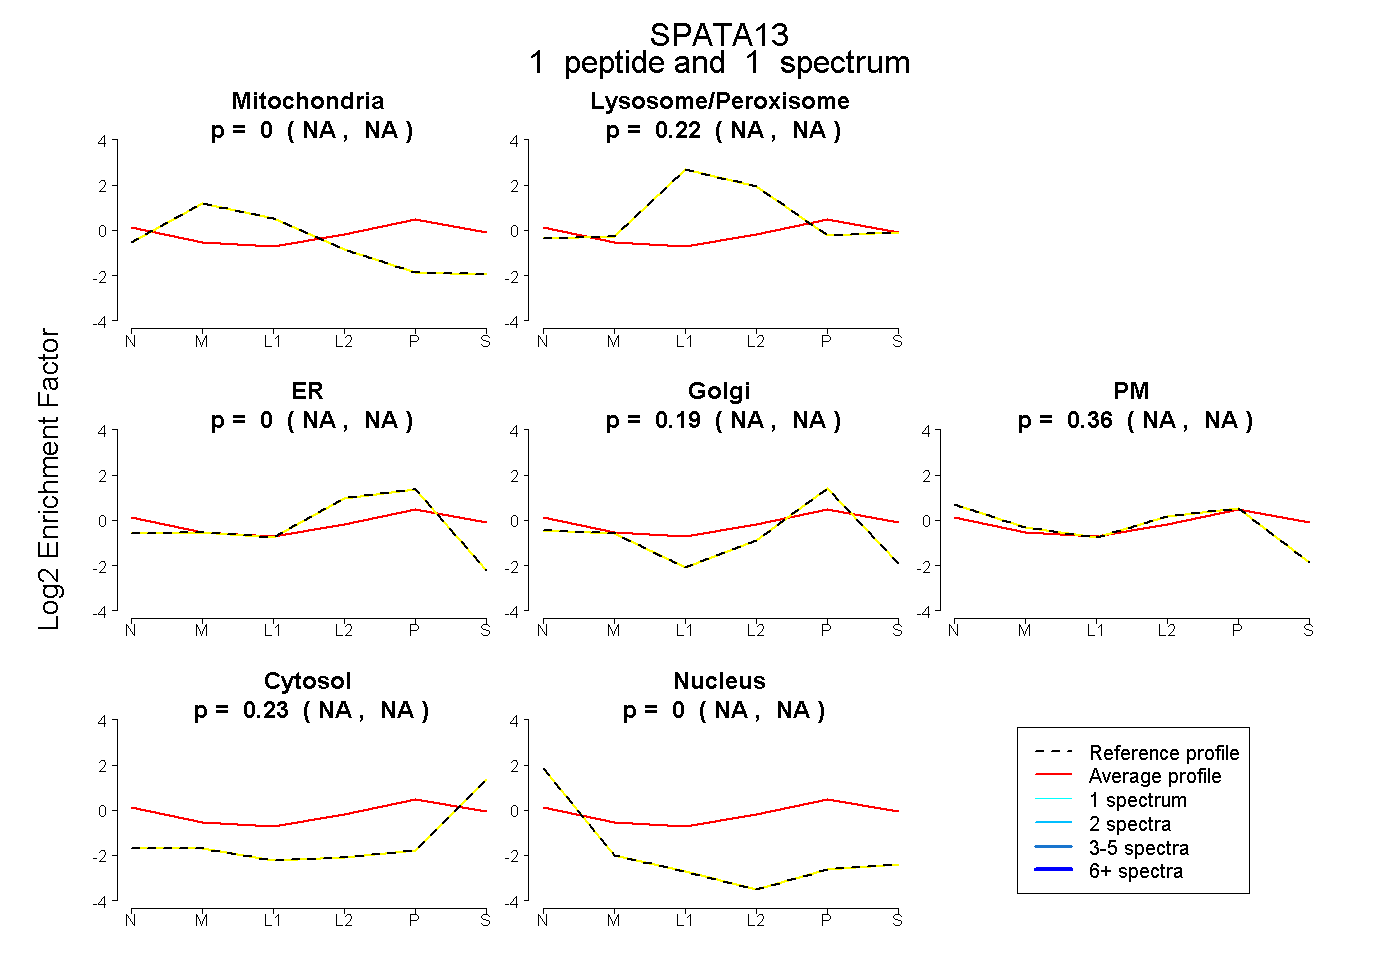
NA | NA
NA | NA
NA | NA
NA | NA
NA | NA
NA | NA
NA | NA
1peptide
spectrum
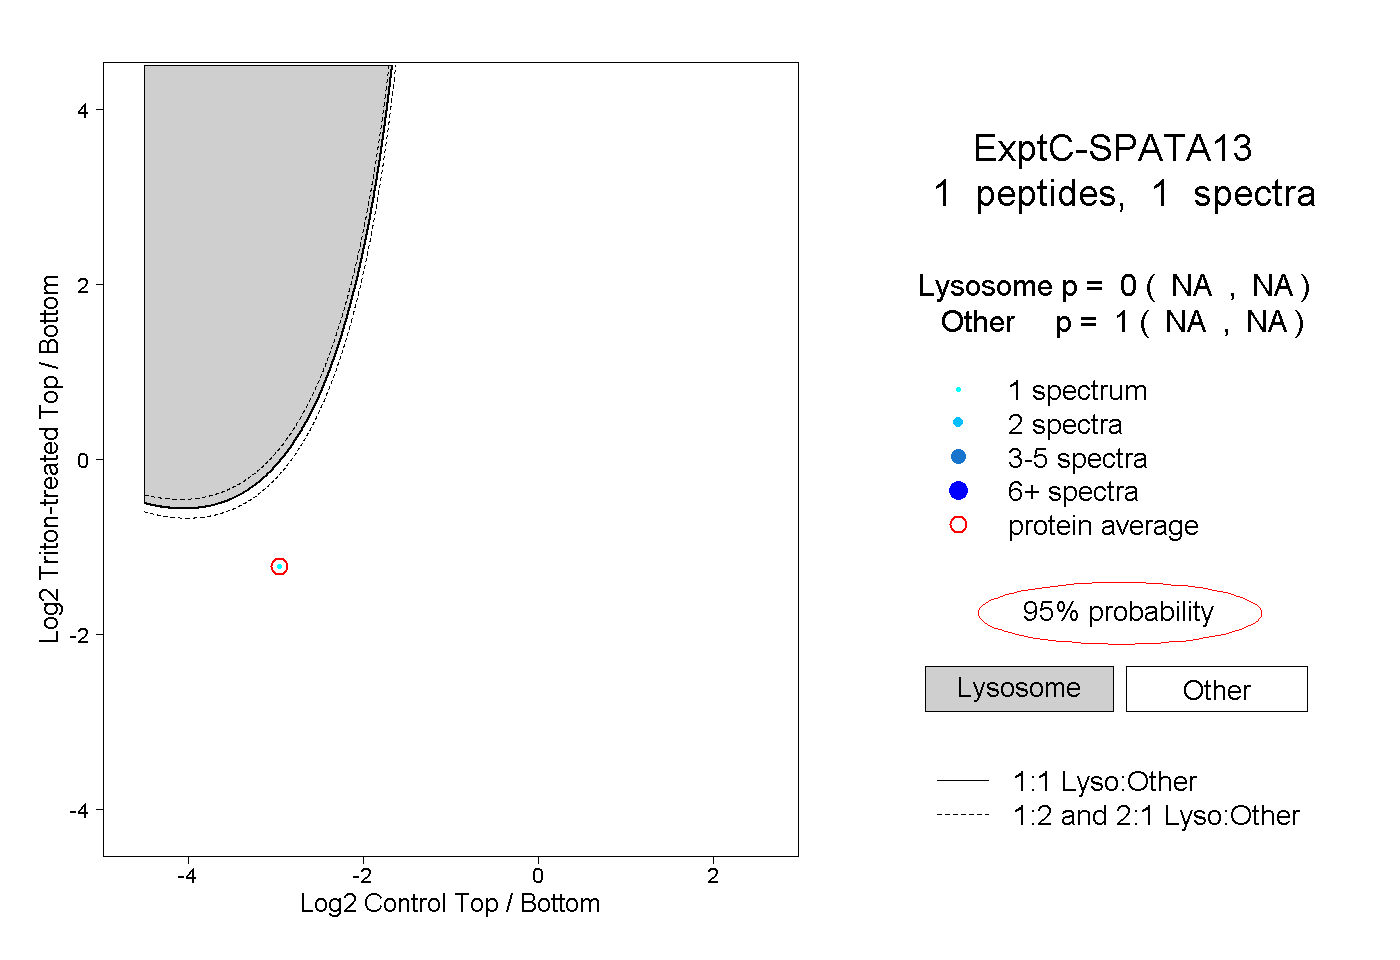
NA | NA
NA | NA