 3
3peptides
spectra
0.124 | 0.253
0.000 | 0.023
0.155 | 0.277
0.000 | 0.000
0.000 | 0.162
0.324 | 0.542
0.000 | 0.132
0.000 | 0.020
| Plot | Mito | Lyso | Perox | ER | Golgi | PM | Cytosol | Nucleus | |||||
| Expt A |
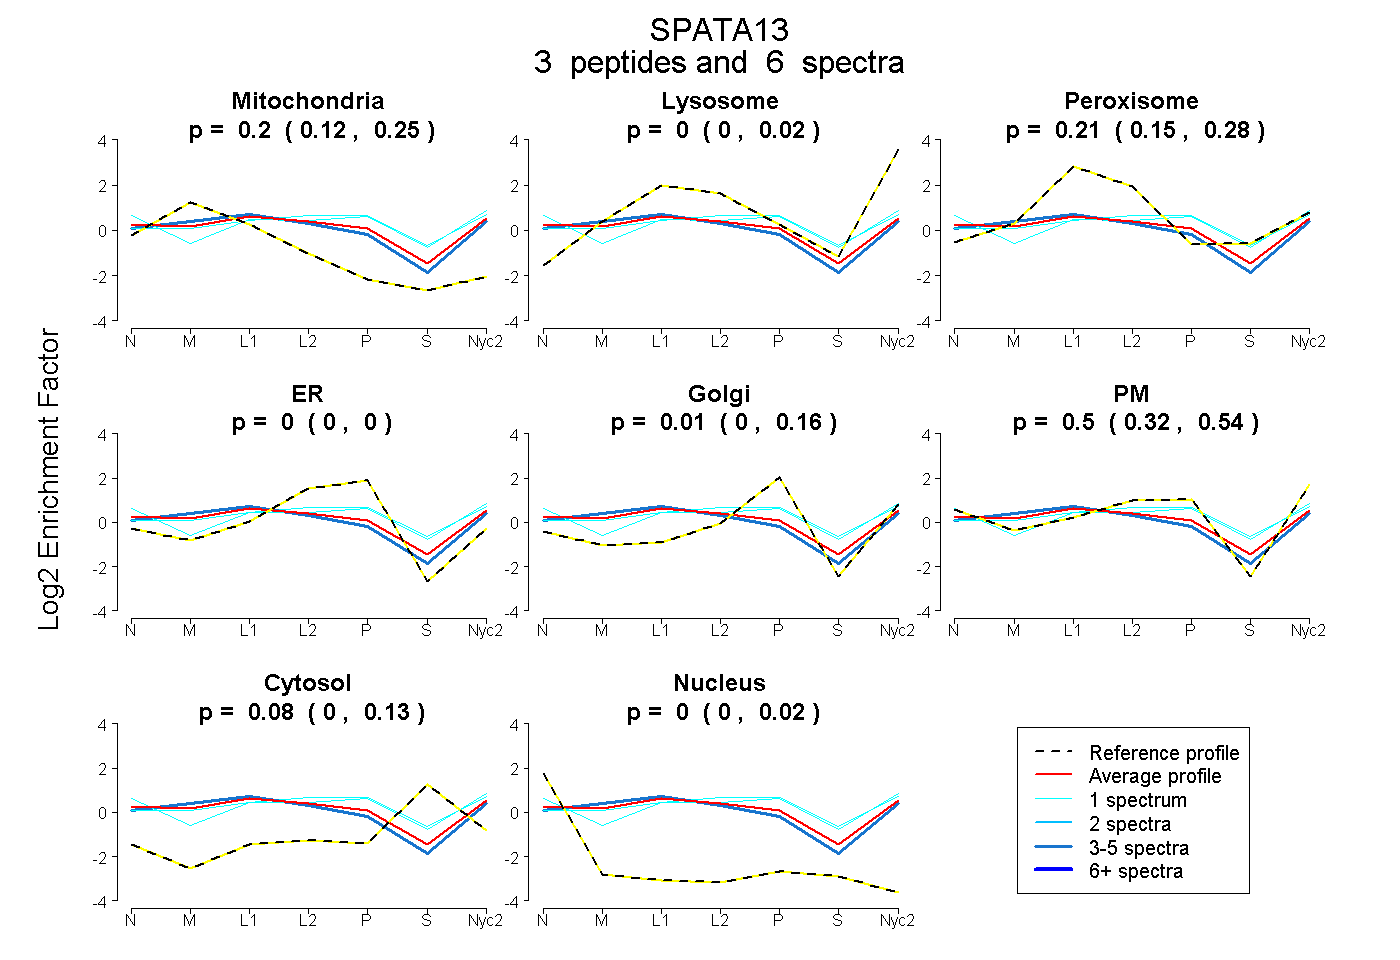
3 peptides |
6 spectra |
|
0.196 0.124 | 0.253 |
0.000 0.000 | 0.023 |
0.210 0.155 | 0.277 |
0.000 0.000 | 0.000 |
0.010 0.000 | 0.162 |
0.500 0.324 | 0.542 |
0.085 0.000 | 0.132 |
0.000 0.000 | 0.020 |
| 4 spectra, ISLLDLGR | 0.309 | 0.038 | 0.180 | 0.000 | 0.029 | 0.420 | 0.024 | 0.000 | ||
| 1 spectrum, YPLQLAELLK | 0.000 | 0.000 | 0.181 | 0.000 | 0.000 | 0.605 | 0.215 | 0.000 | ||
| 1 spectrum, LAMLNAQK | 0.011 | 0.000 | 0.347 | 0.000 | 0.199 | 0.300 | 0.142 | 0.000 |
| Plot | Mito | Lyso or Perox | ER | Golgi | PM | Cytosol | Nucleus | ||||||
| Expt B |
1 peptide |
1 spectrum |
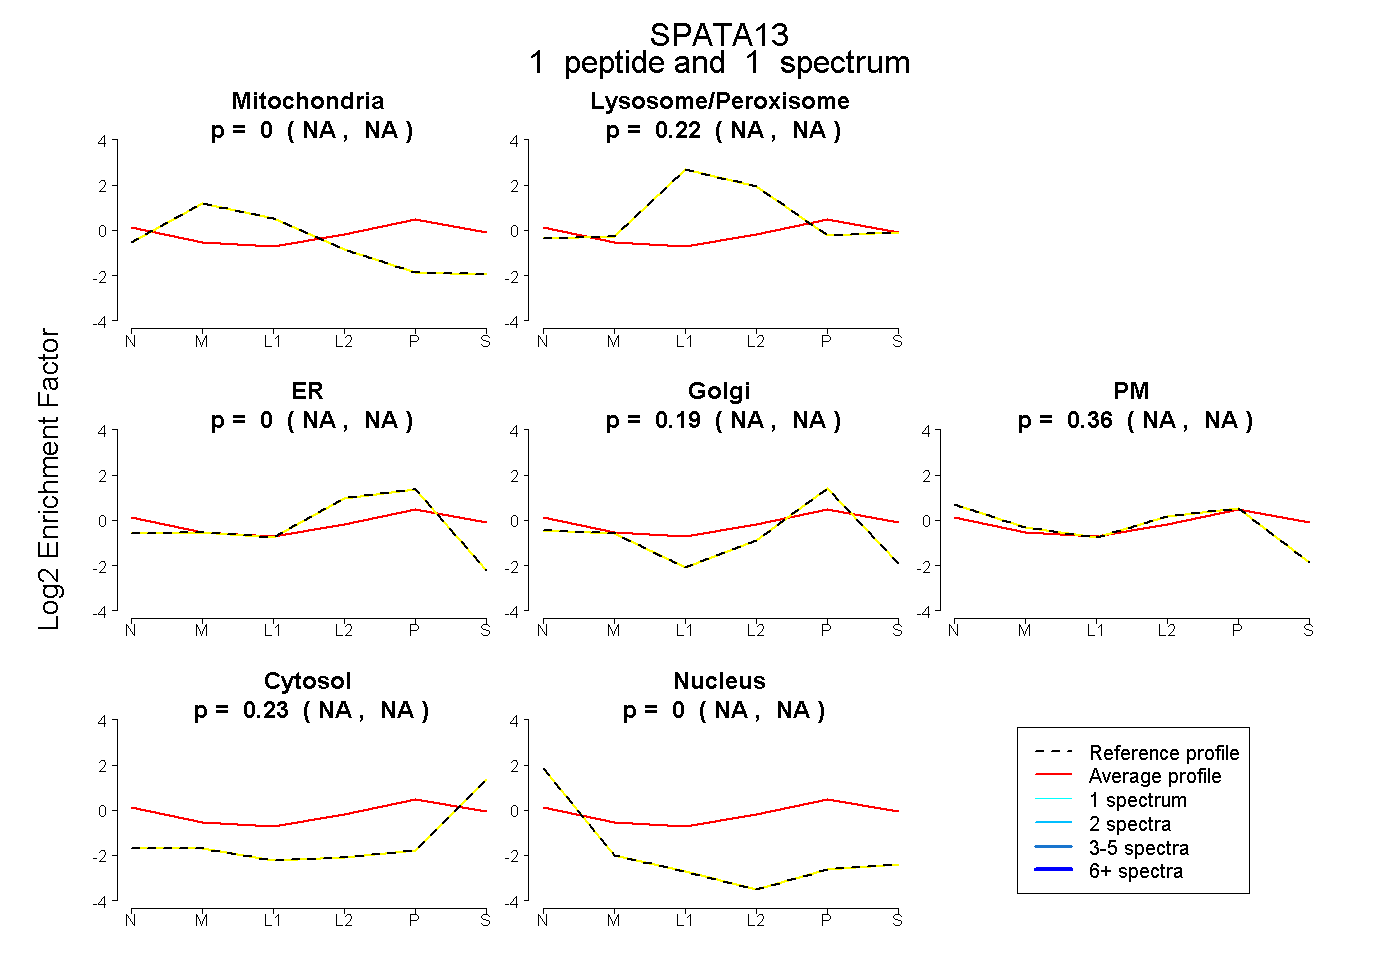 |
0.000 NA | NA |
0.215 NA | NA |
0.000 NA | NA |
0.194 NA | NA |
0.360 NA | NA |
0.231 NA | NA |
0.000 NA | NA |
|||
| Plot | Lyso | Other | |||||||||||
| Expt C |
1 peptide |
1 spectrum |
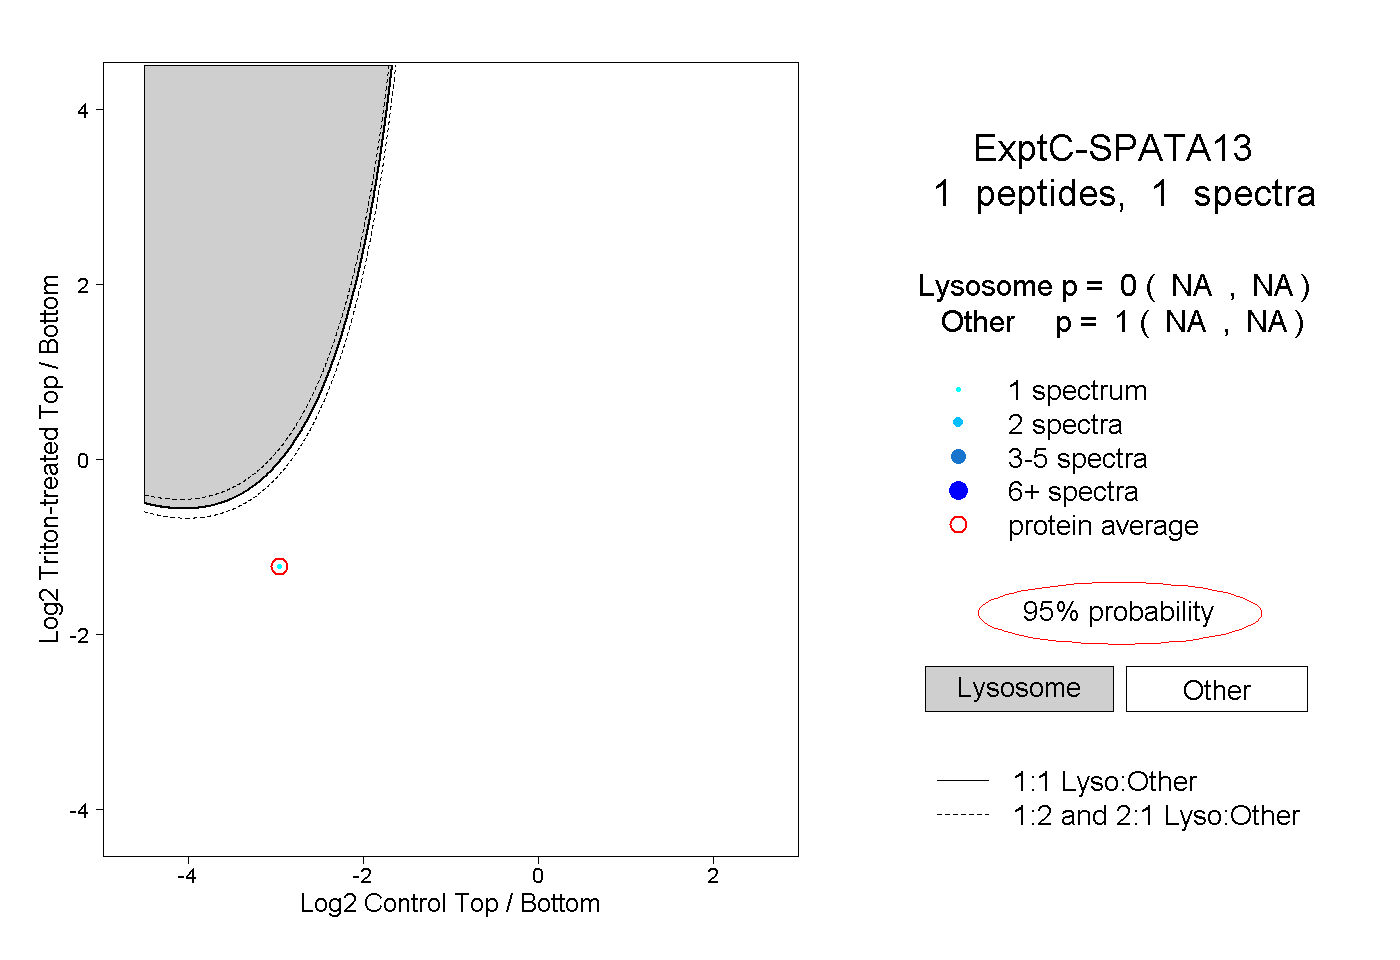 |
0.000 NA | NA |
1.000 NA | NA |