 8
8peptides
spectra
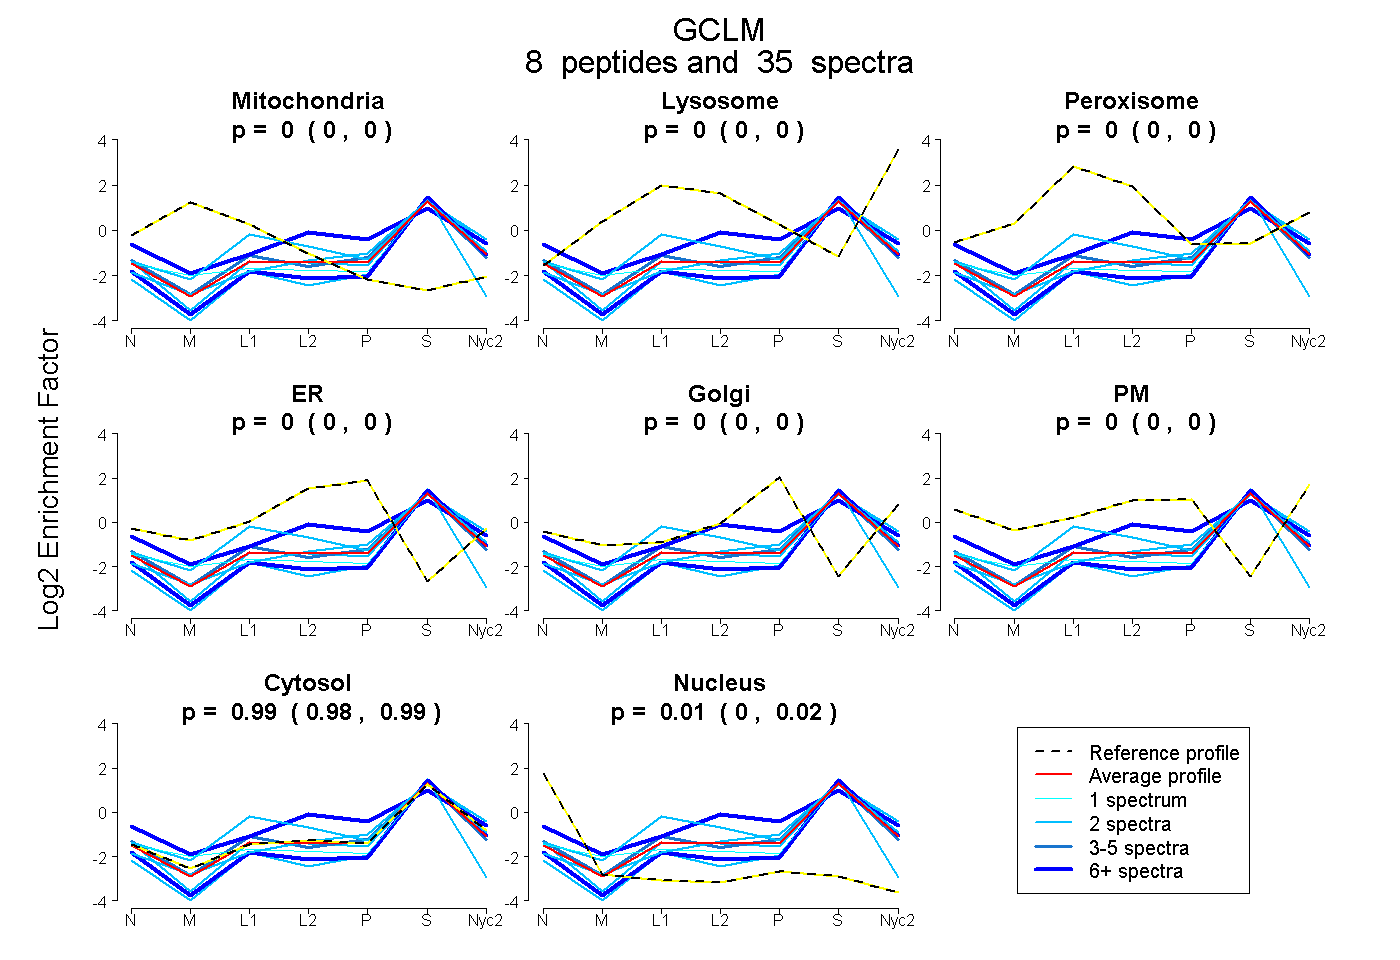
0.000 | 0.000
0.000 | 0.000
0.000 | 0.000
0.000 | 0.000
0.000 | 0.000
0.000 | 0.000
0.977 | 0.994
0.004 | 0.021
5peptides
spectra
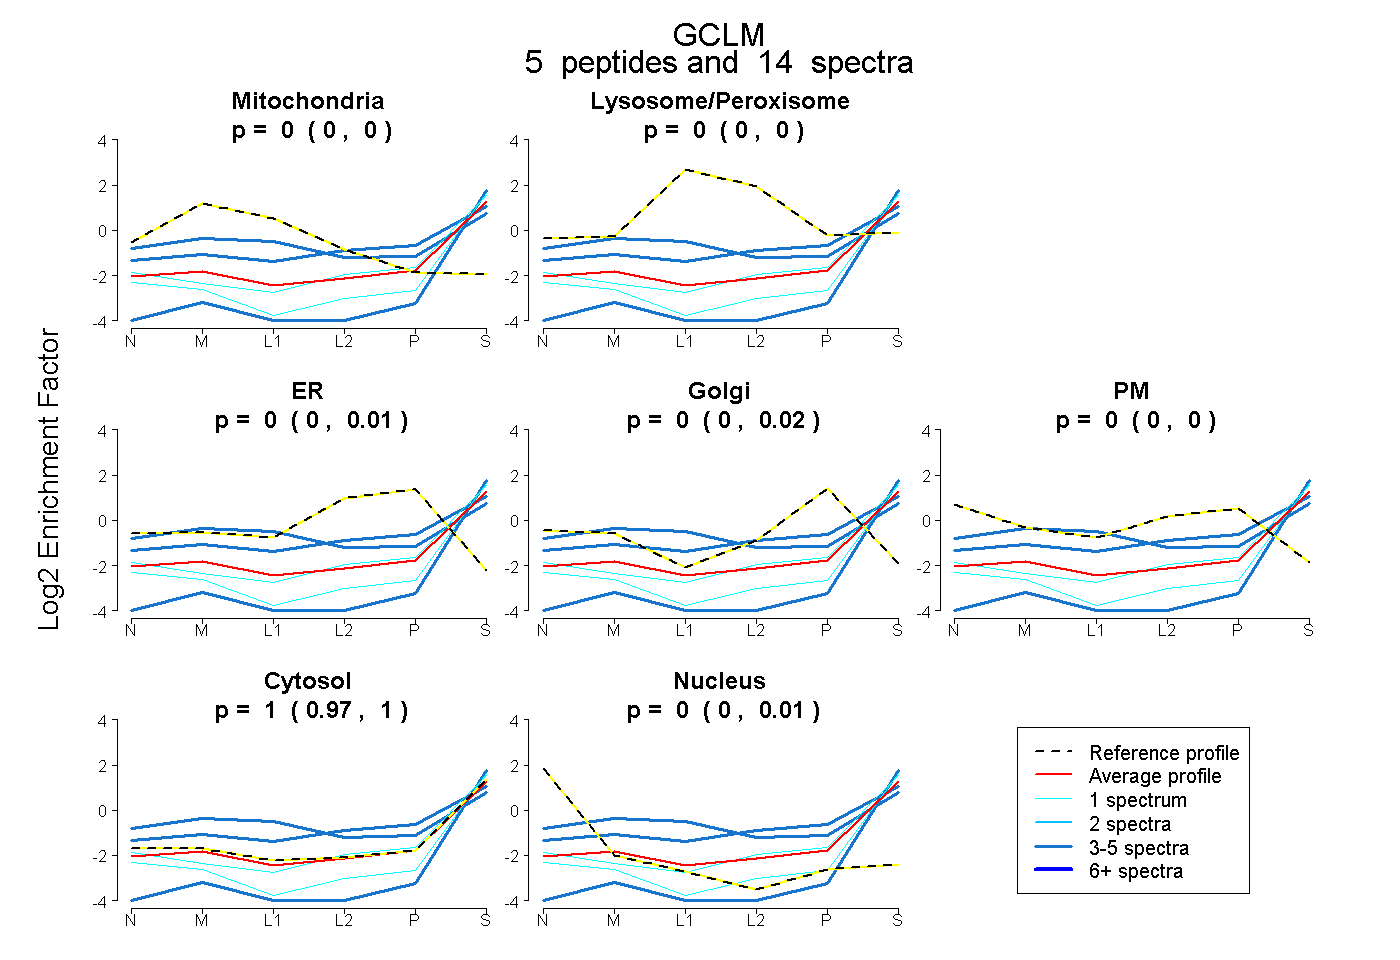
0.000 | 0.000
0.000 | 0.000
0.000 | 0.008
0.000 | 0.018
0.000 | 0.000
0.965 | 1.000
0.000 | 0.009
8peptides
spectra
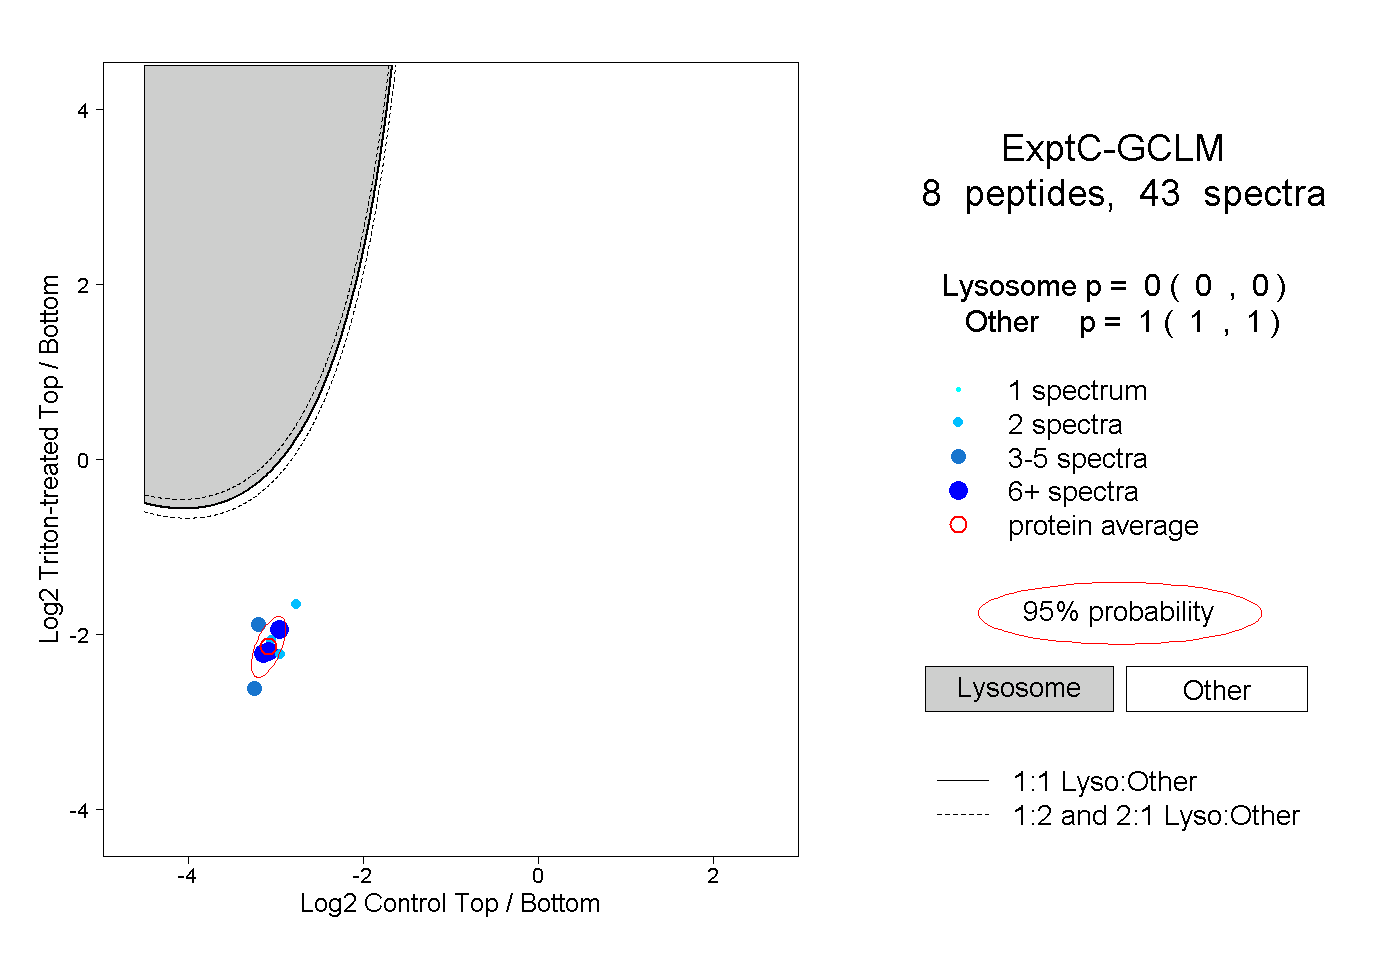
0.000 | 0.000
1.000 | 1.000