 8
8peptides
spectra
0.000 | 0.000
0.000 | 0.000
0.000 | 0.000
0.000 | 0.000
0.000 | 0.000
0.000 | 0.000
0.977 | 0.994
0.004 | 0.021
| Plot | Mito | Lyso | Perox | ER | Golgi | PM | Cytosol | Nucleus | |||||
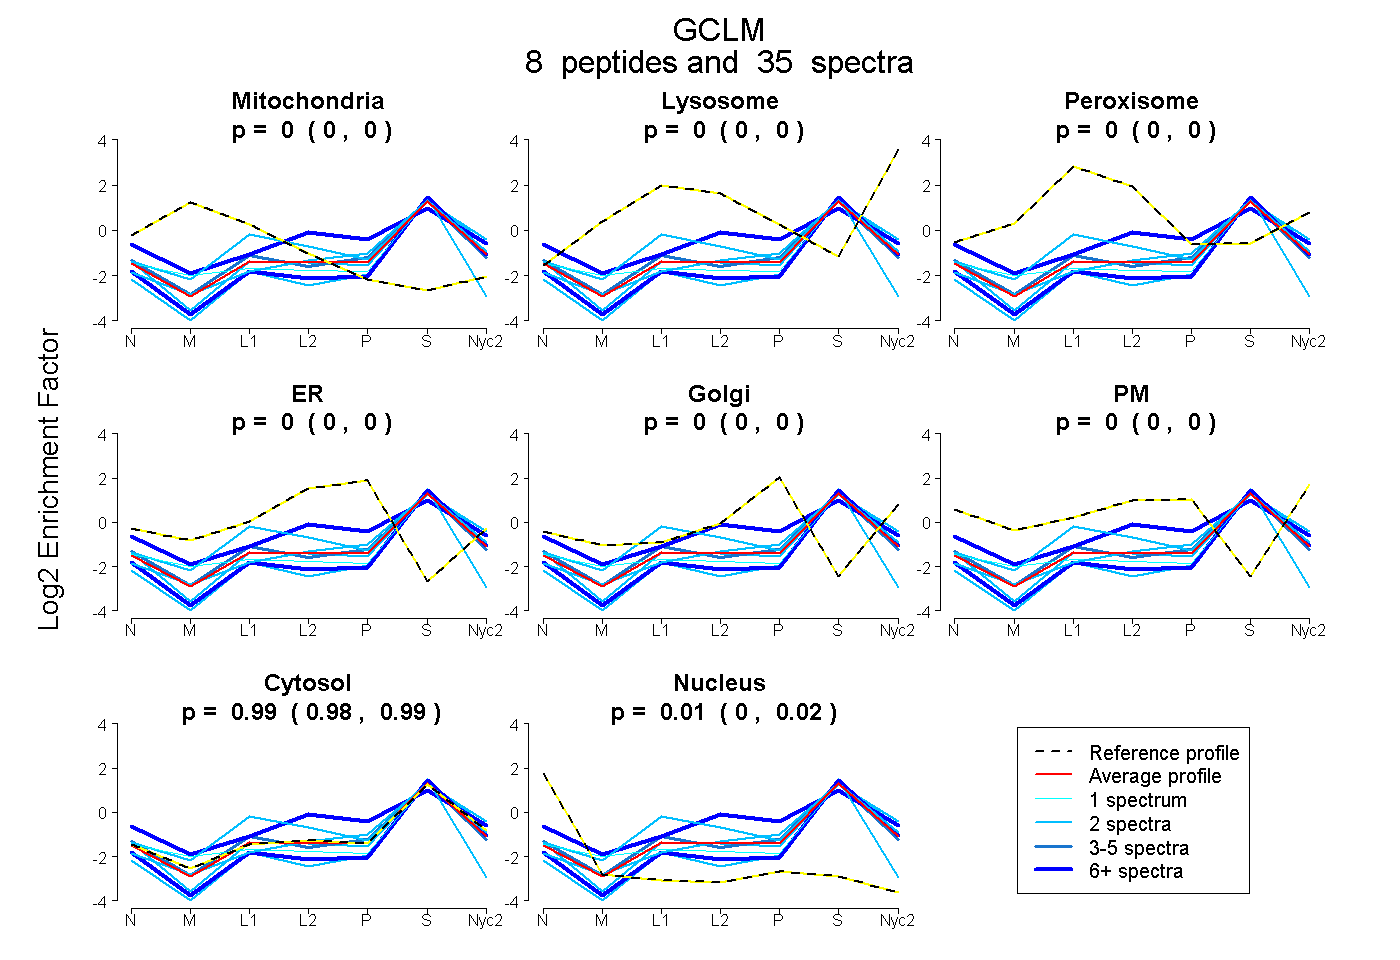
| Expt A |
8 peptides |
35 spectra |
|
0.000 0.000 | 0.000 |
0.000 0.000 | 0.000 |
0.000 0.000 | 0.000 |
0.000 0.000 | 0.000 |
0.000 0.000 | 0.000 |
0.000 0.000 | 0.000 |
0.987 0.977 | 0.994 |
0.013 0.004 | 0.021 |
| 2 spectra, AAGALLAR | 0.000 | 0.000 | 0.000 | 0.000 | 0.000 | 0.000 | 1.000 | 0.000 | ||
| 1 spectrum, QFDIQLLTHNDPK | 0.035 | 0.000 | 0.000 | 0.000 | 0.000 | 0.000 | 0.944 | 0.021 | ||
| 2 spectra, EFPDVLECTMSHAVEK | 0.000 | 0.000 | 0.000 | 0.000 | 0.000 | 0.000 | 0.848 | 0.152 | ||
| 7 spectra, CPSTHSEELR | 0.000 | 0.000 | 0.068 | 0.170 | 0.000 | 0.032 | 0.730 | 0.000 | ||
| 15 spectra, LFIVGSNSSSSTR | 0.000 | 0.000 | 0.000 | 0.000 | 0.000 | 0.000 | 0.953 | 0.047 | ||
| 4 spectra, ASTLHLQTGNLLNWGR | 0.000 | 0.000 | 0.000 | 0.000 | 0.000 | 0.000 | 0.974 | 0.026 | ||
| 2 spectra, YSVIVK | 0.000 | 0.000 | 0.000 | 0.000 | 0.000 | 0.000 | 1.000 | 0.000 | ||
| 2 spectra, GYILQAK | 0.000 | 0.000 | 0.205 | 0.000 | 0.000 | 0.000 | 0.795 | 0.000 |
| Plot | Mito | Lyso or Perox | ER | Golgi | PM | Cytosol | Nucleus | ||||||
| Expt B |
5 peptides |
14 spectra |
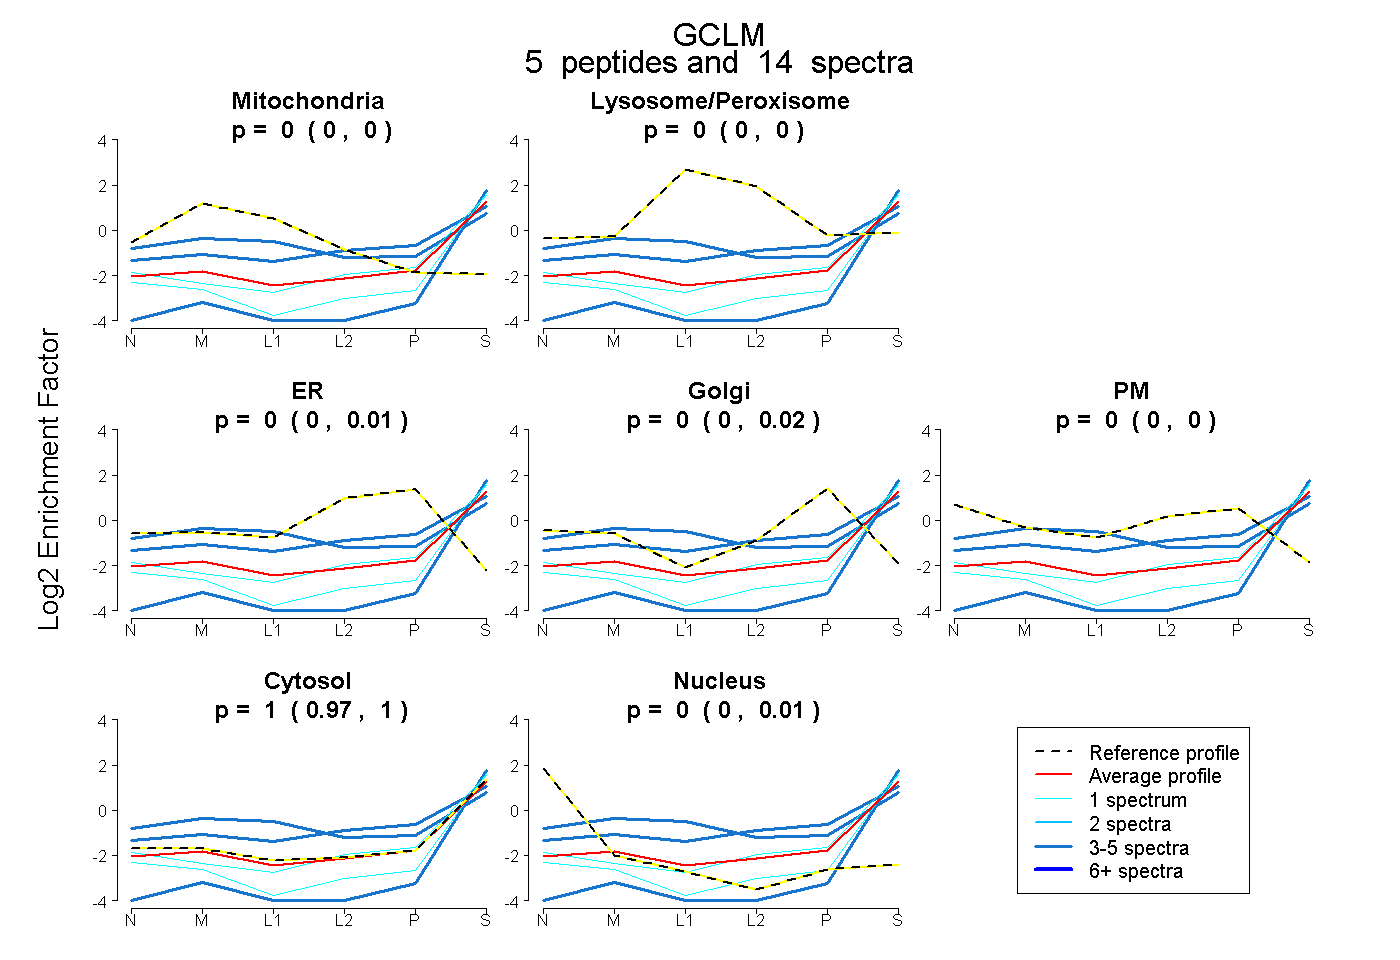 |
0.000 0.000 | 0.000 |
0.000 0.000 | 0.000 |
0.000 0.000 | 0.008 |
0.000 0.000 | 0.018 |
0.000 0.000 | 0.000 |
1.000 0.965 | 1.000 |
0.000 0.000 | 0.009 |
|||
| Plot | Lyso | Other | |||||||||||
| Expt C |
8 peptides |
43 spectra |
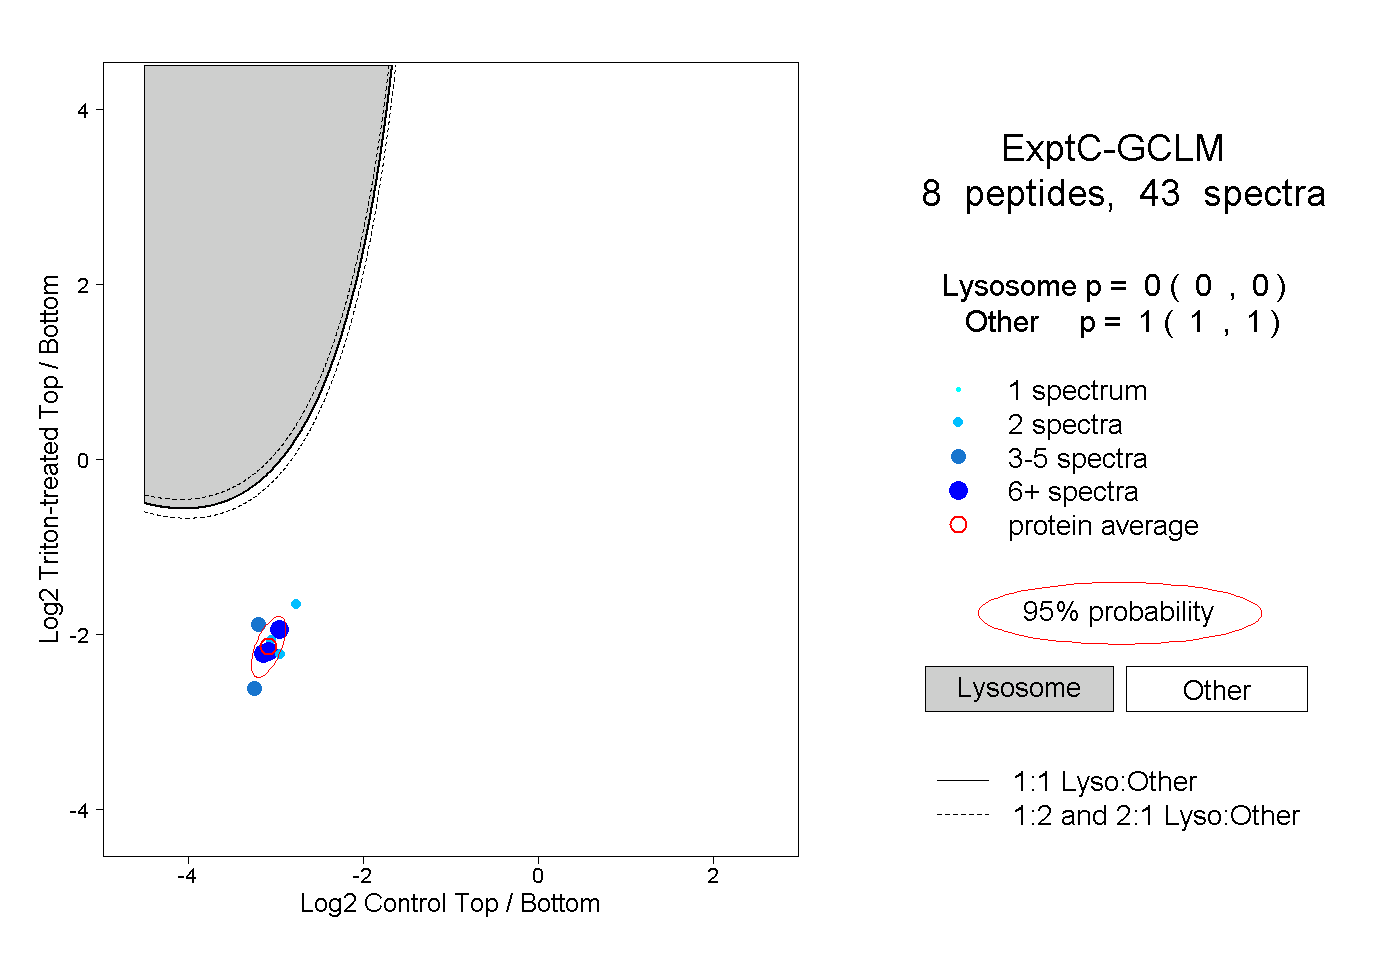 |
0.000 0.000 | 0.000 |
1.000 1.000 | 1.000 |