 27
27peptides
spectra
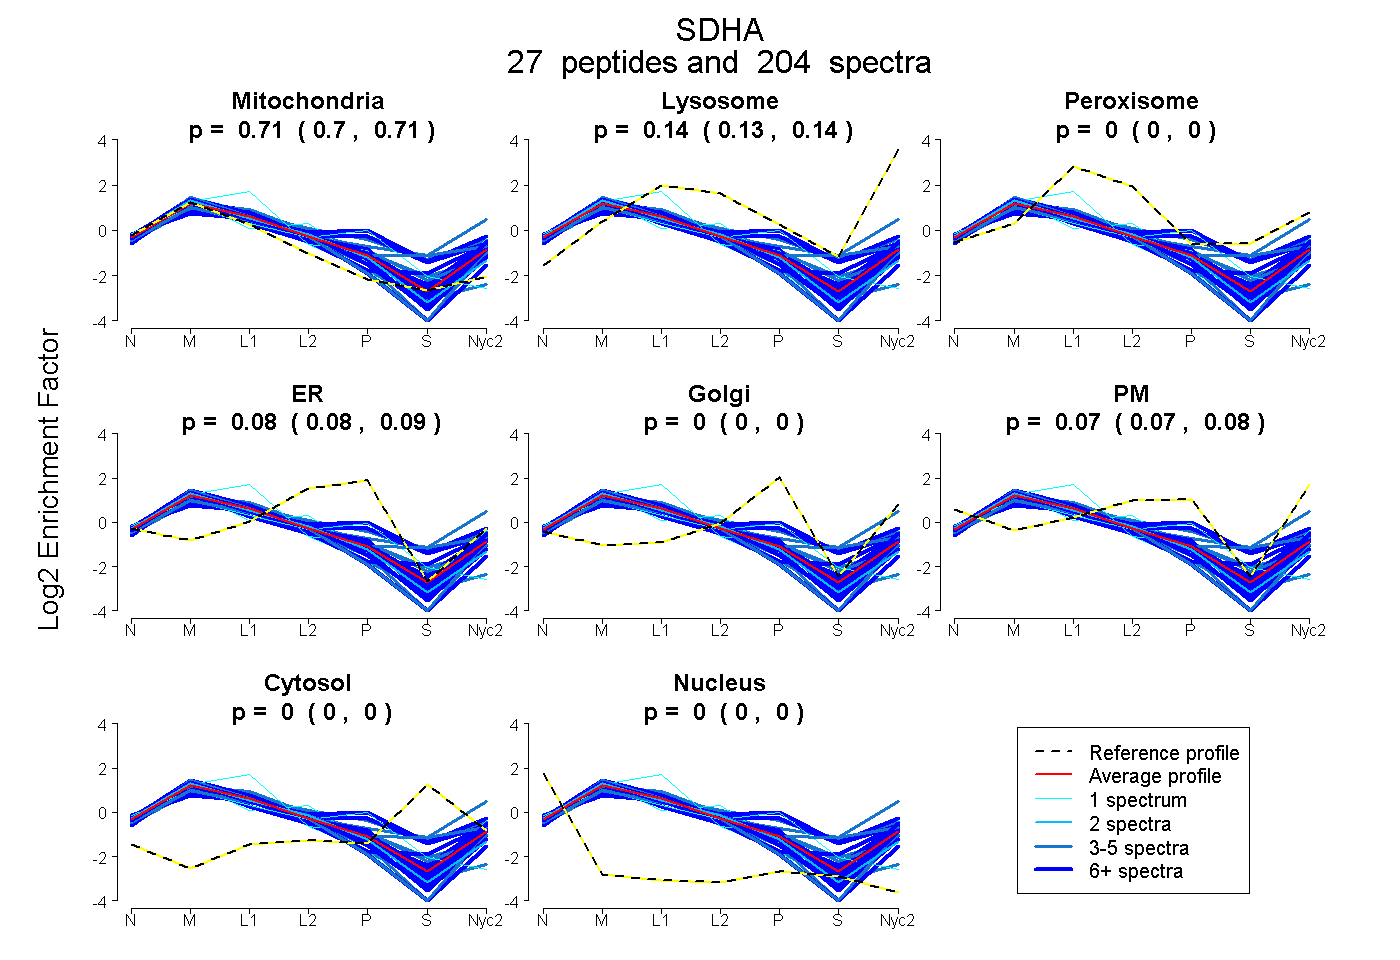
0.704 | 0.708
0.134 | 0.139
0.000 | 0.000
0.080 | 0.089
0.000 | 0.000
0.067 | 0.076
0.000 | 0.000
0.000 | 0.000
22peptides
spectra
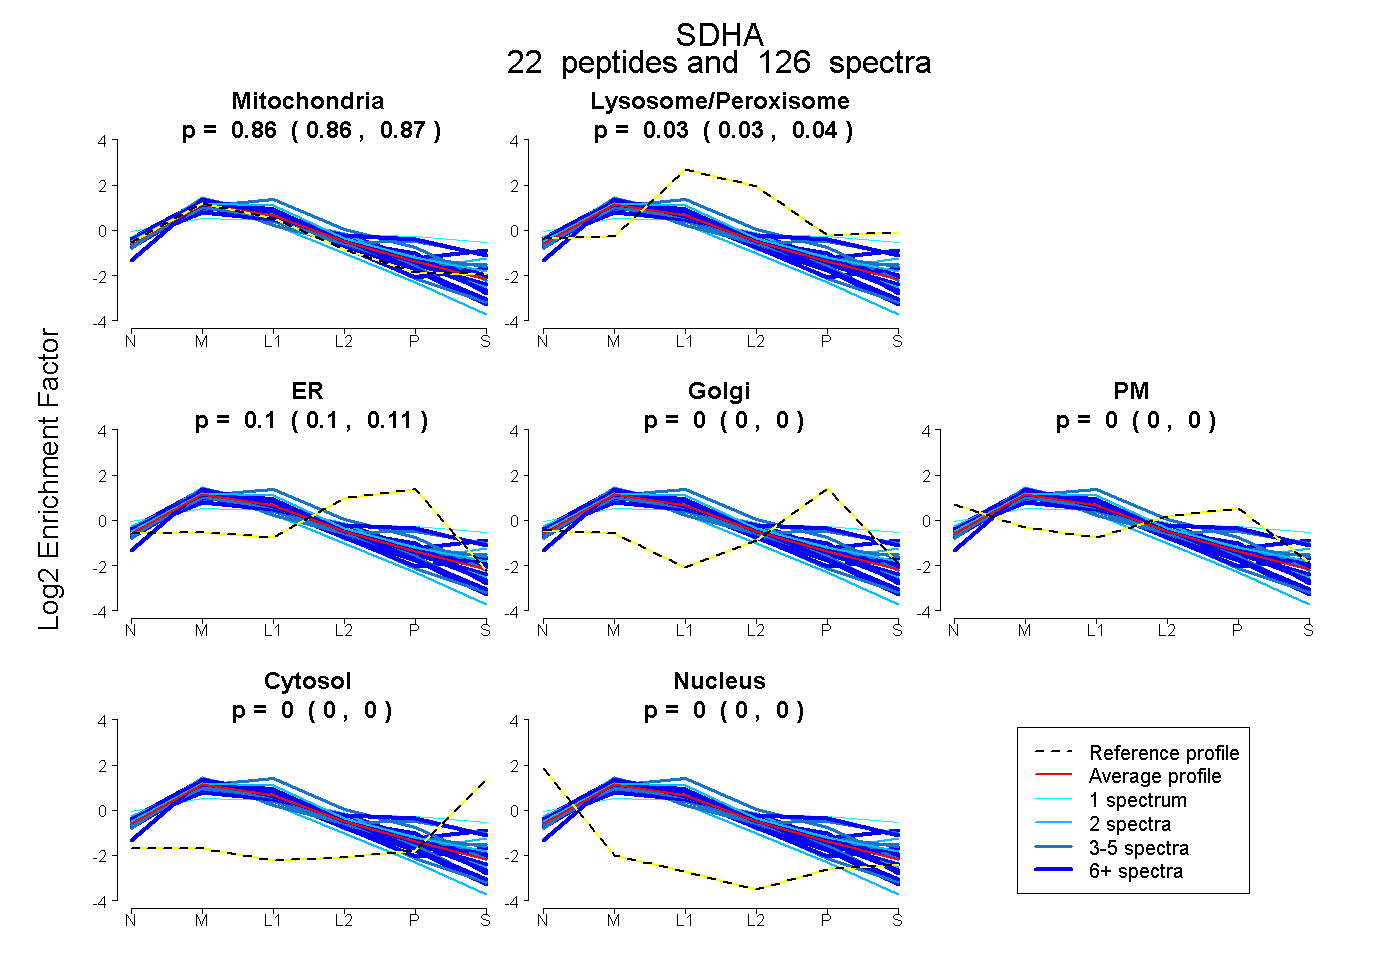
0.860 | 0.868
0.030 | 0.038
0.097 | 0.105
0.000 | 0.000
0.000 | 0.000
0.000 | 0.000
0.000 | 0.000
27peptides
spectra
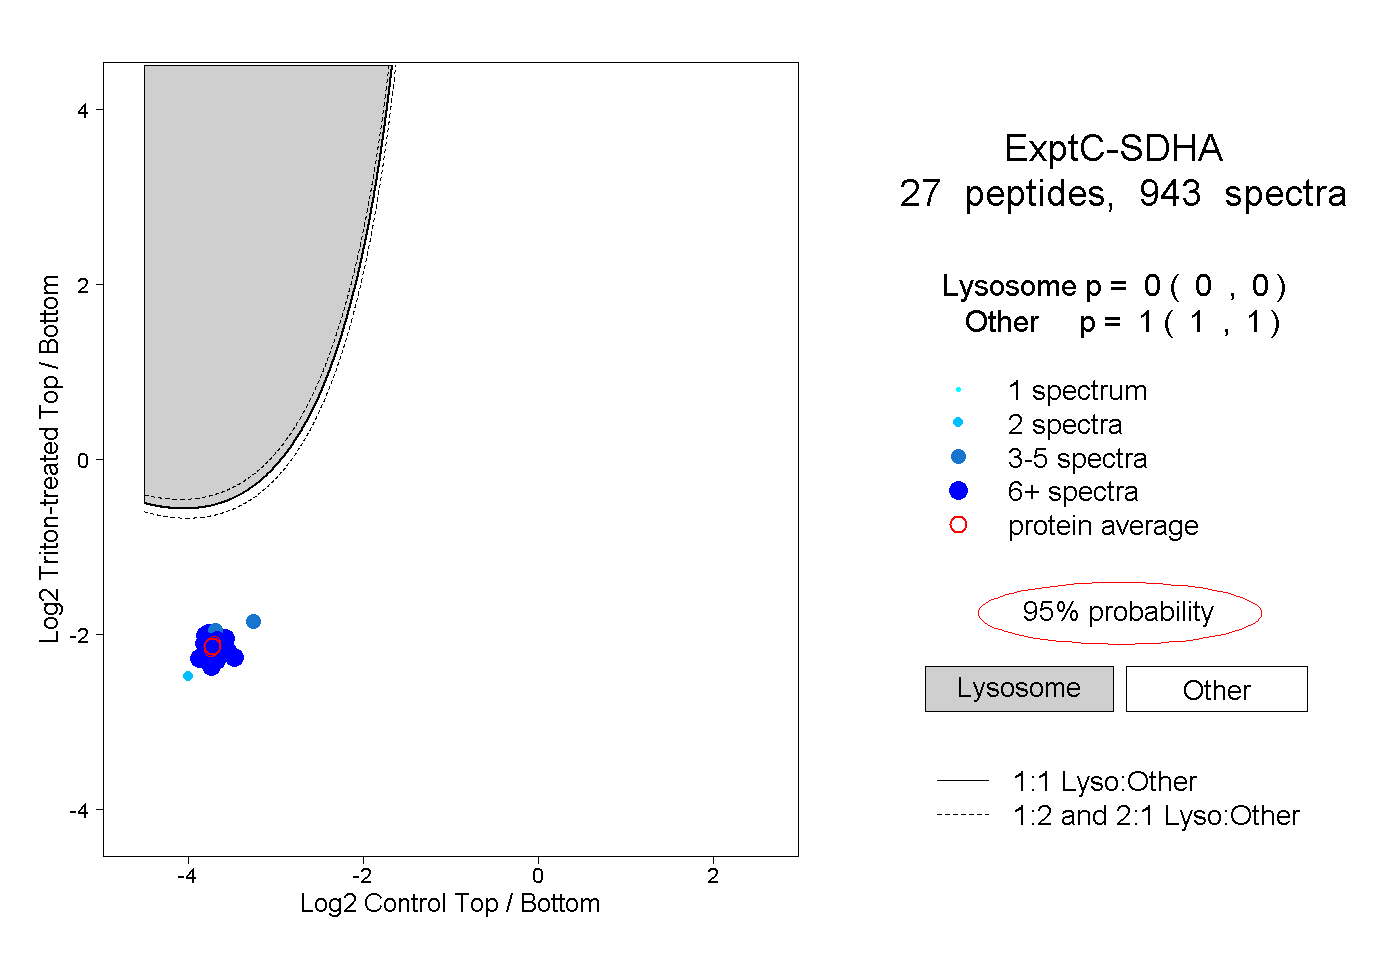
0.000 | 0.000
1.000 | 1.000
16peptides
spectra
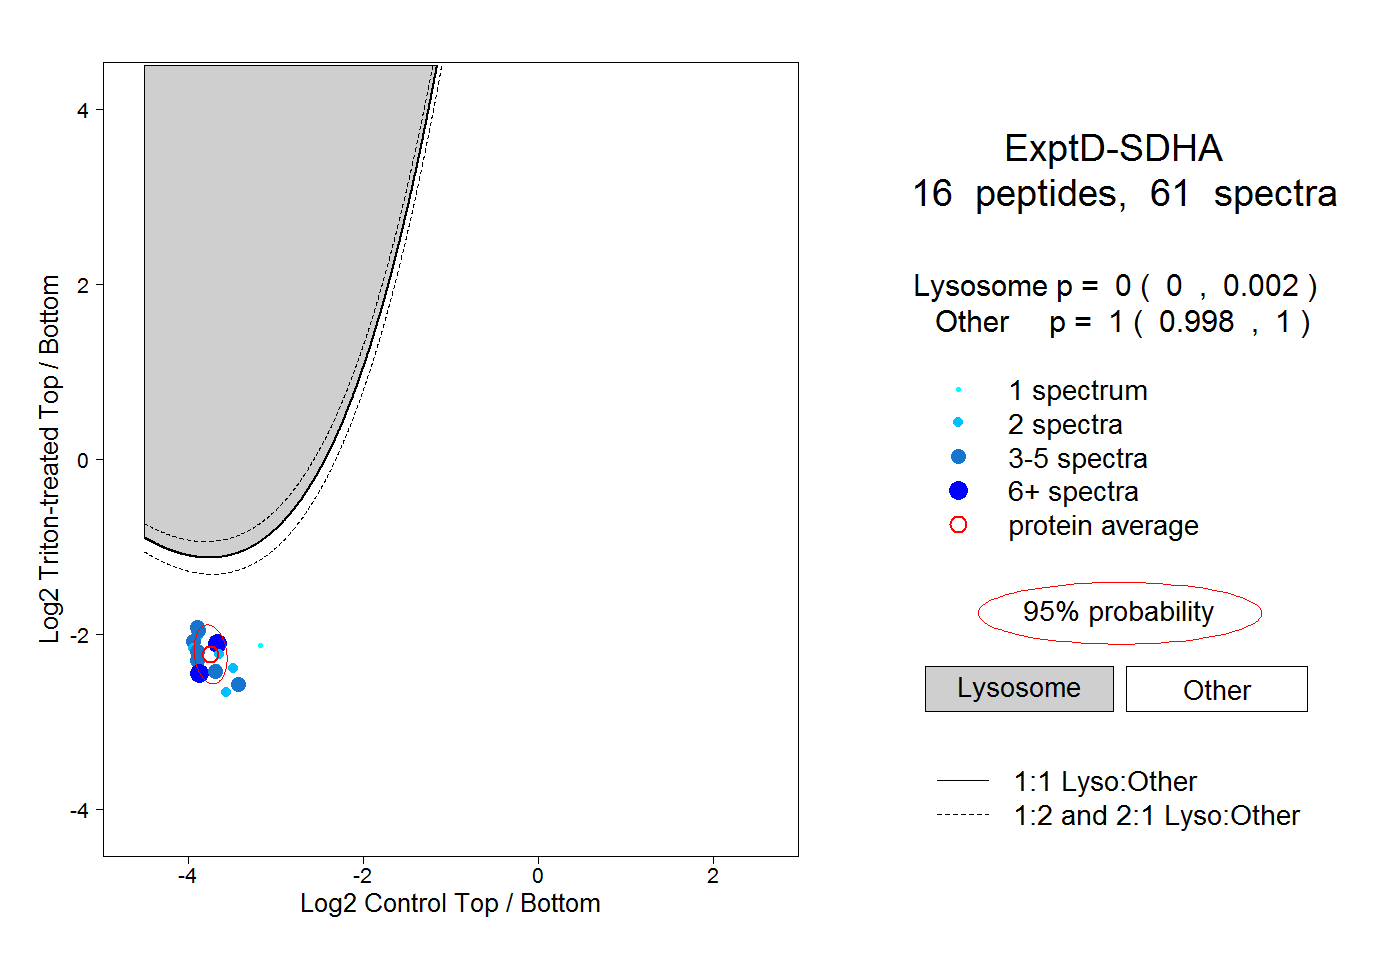
0.000 | 0.002
0.998 | 1.000