 13
13peptides
spectra
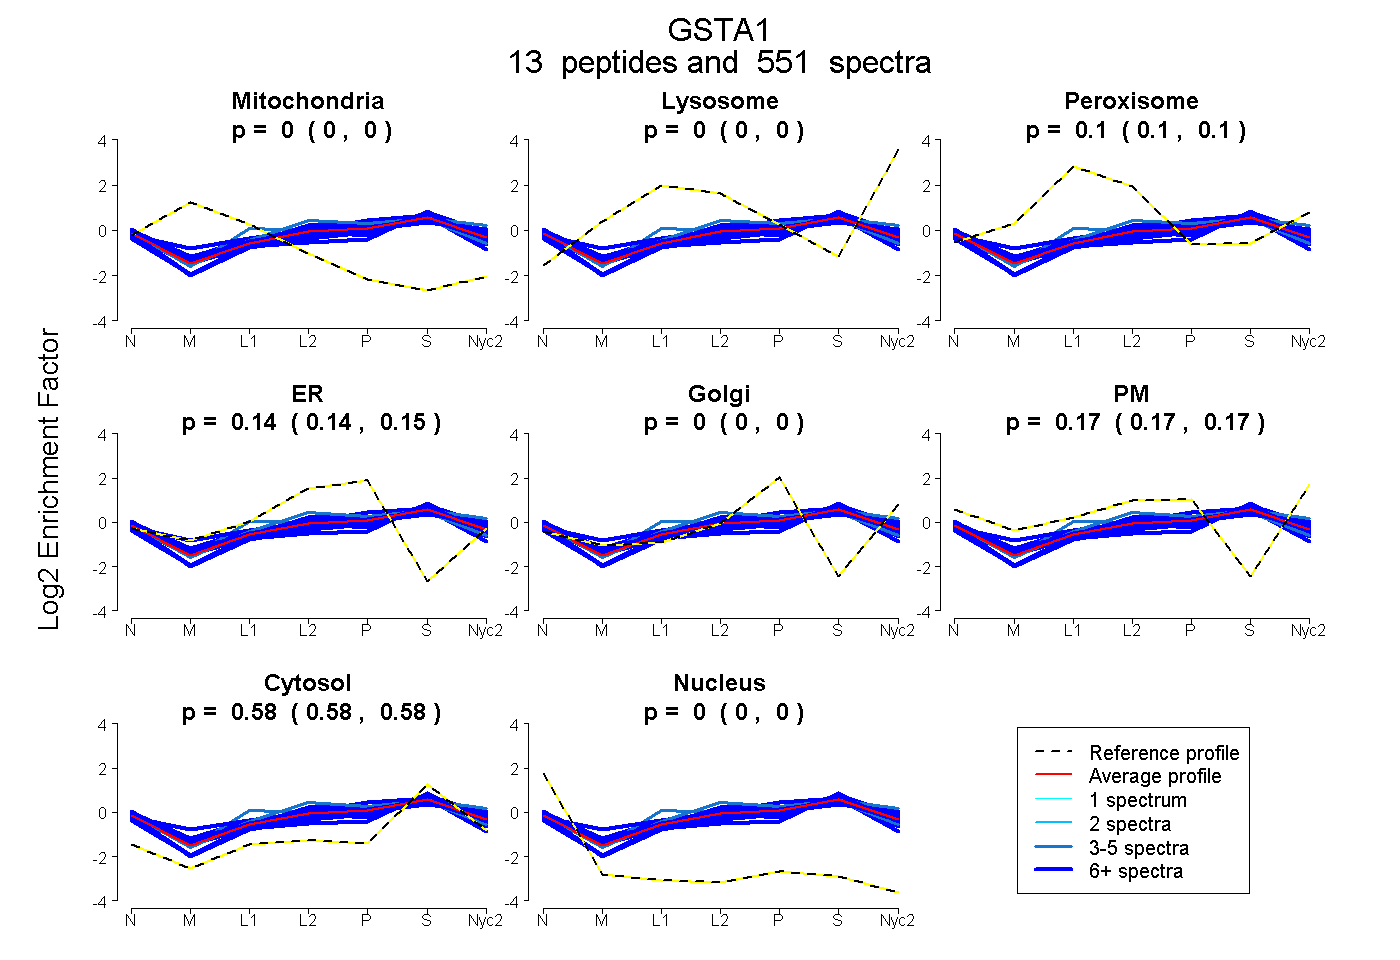
0.000 | 0.000
0.000 | 0.000
0.098 | 0.100
0.143 | 0.147
0.000 | 0.000
0.169 | 0.174
0.584 | 0.585
0.000 | 0.000
6peptides
spectra
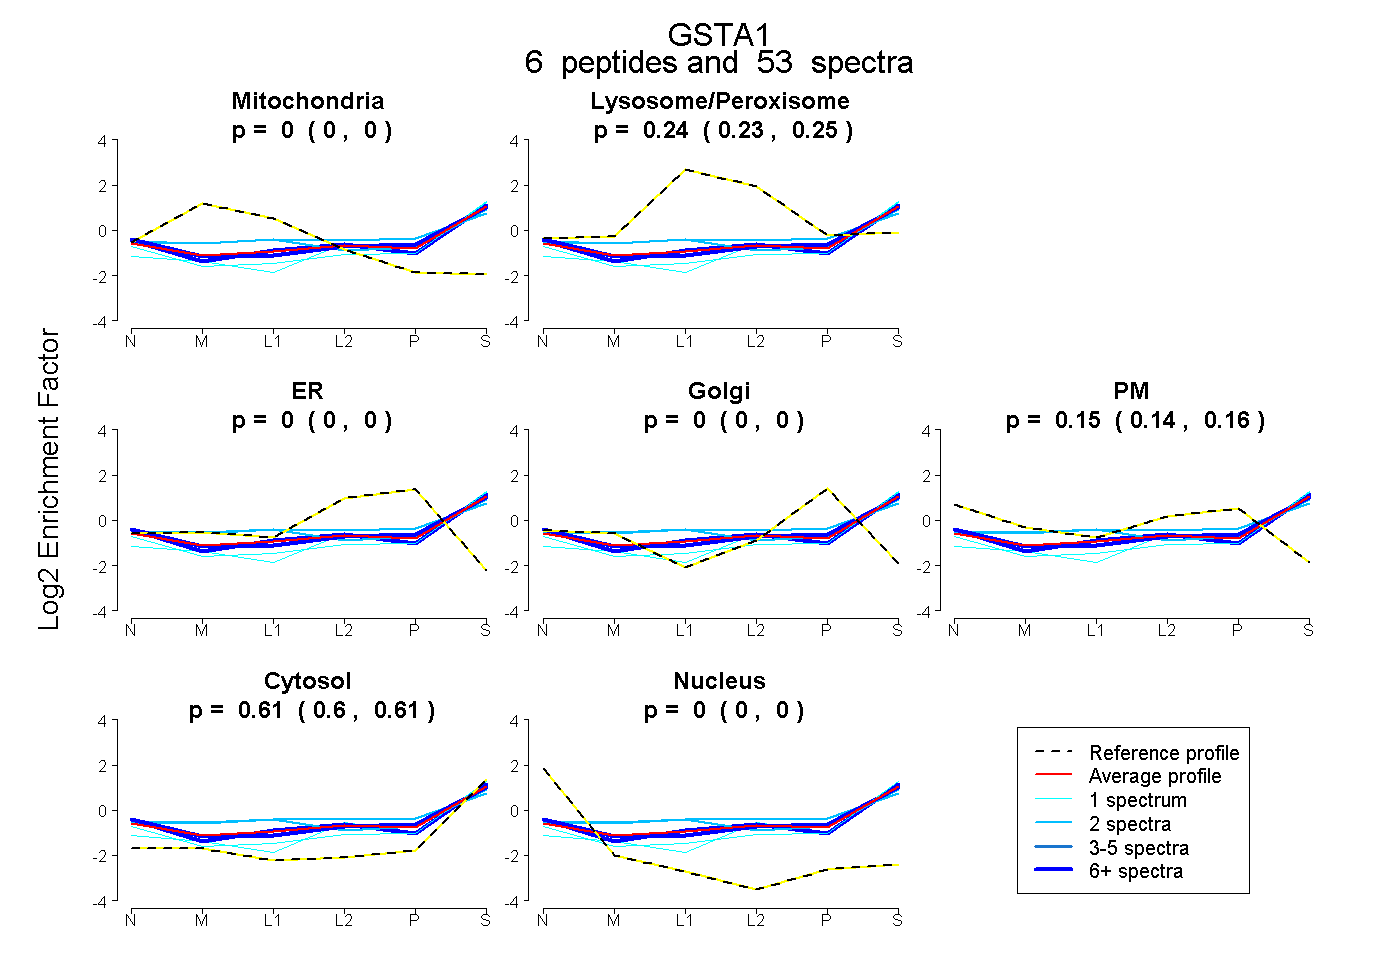
0.000 | 0.000
0.235 | 0.246
0.000 | 0.000
0.000 | 0.000
0.145 | 0.158
0.602 | 0.611
0.000 | 0.000
12peptides
spectra
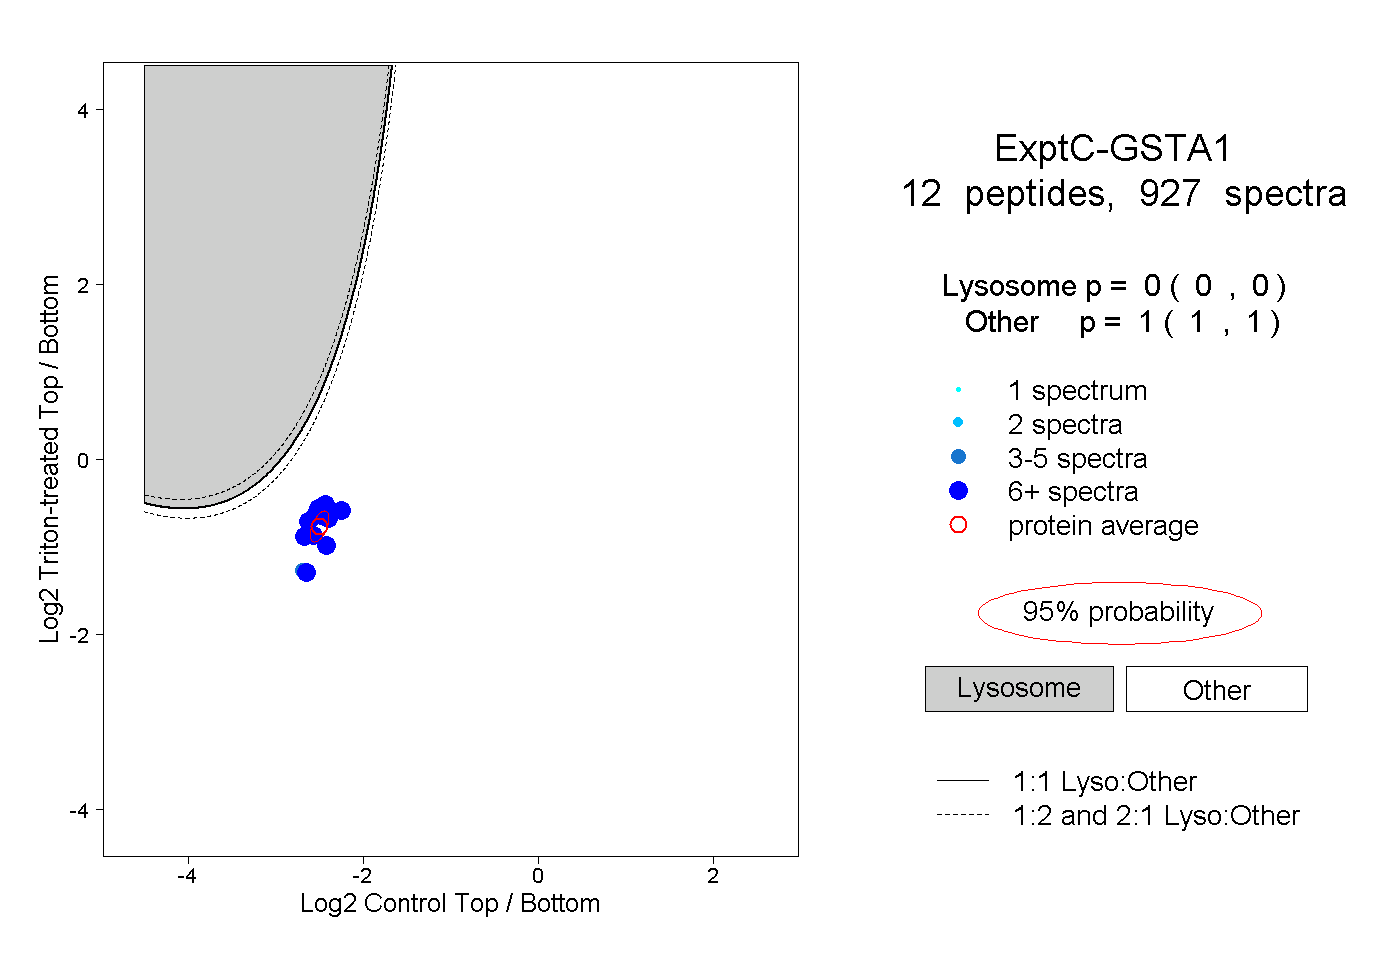
0.000 | 0.000
1.000 | 1.000
8peptides
spectra
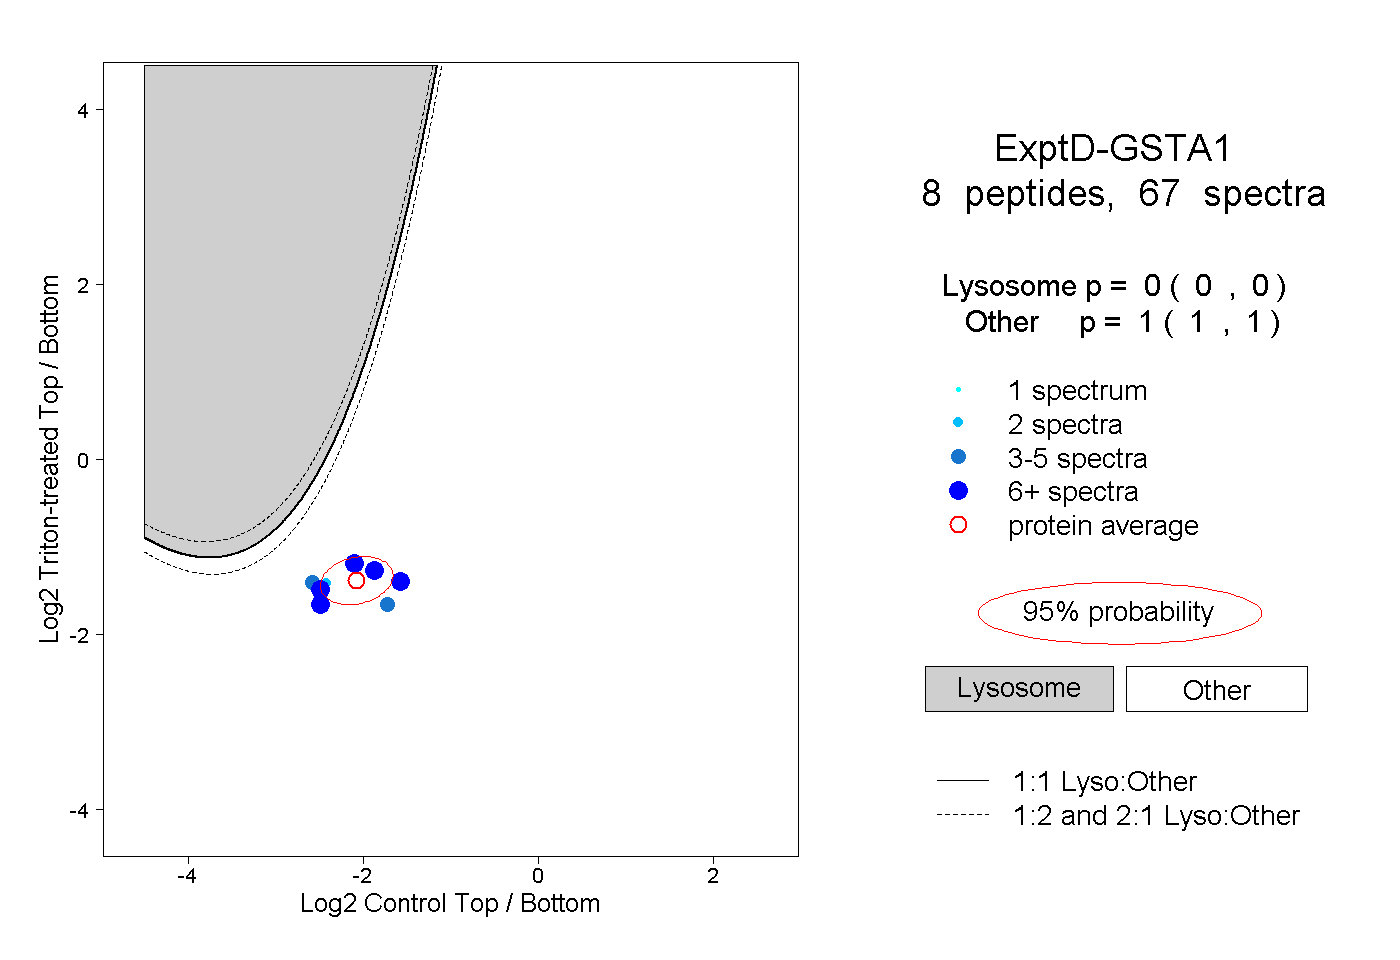
0.000 | 0.000
1.000 | 1.000