 13
13peptides
spectra
0.000 | 0.000
0.000 | 0.000
0.098 | 0.100
0.143 | 0.147
0.000 | 0.000
0.169 | 0.174
0.584 | 0.585
0.000 | 0.000
| Plot | Mito | Lyso | Perox | ER | Golgi | PM | Cytosol | Nucleus | |||||
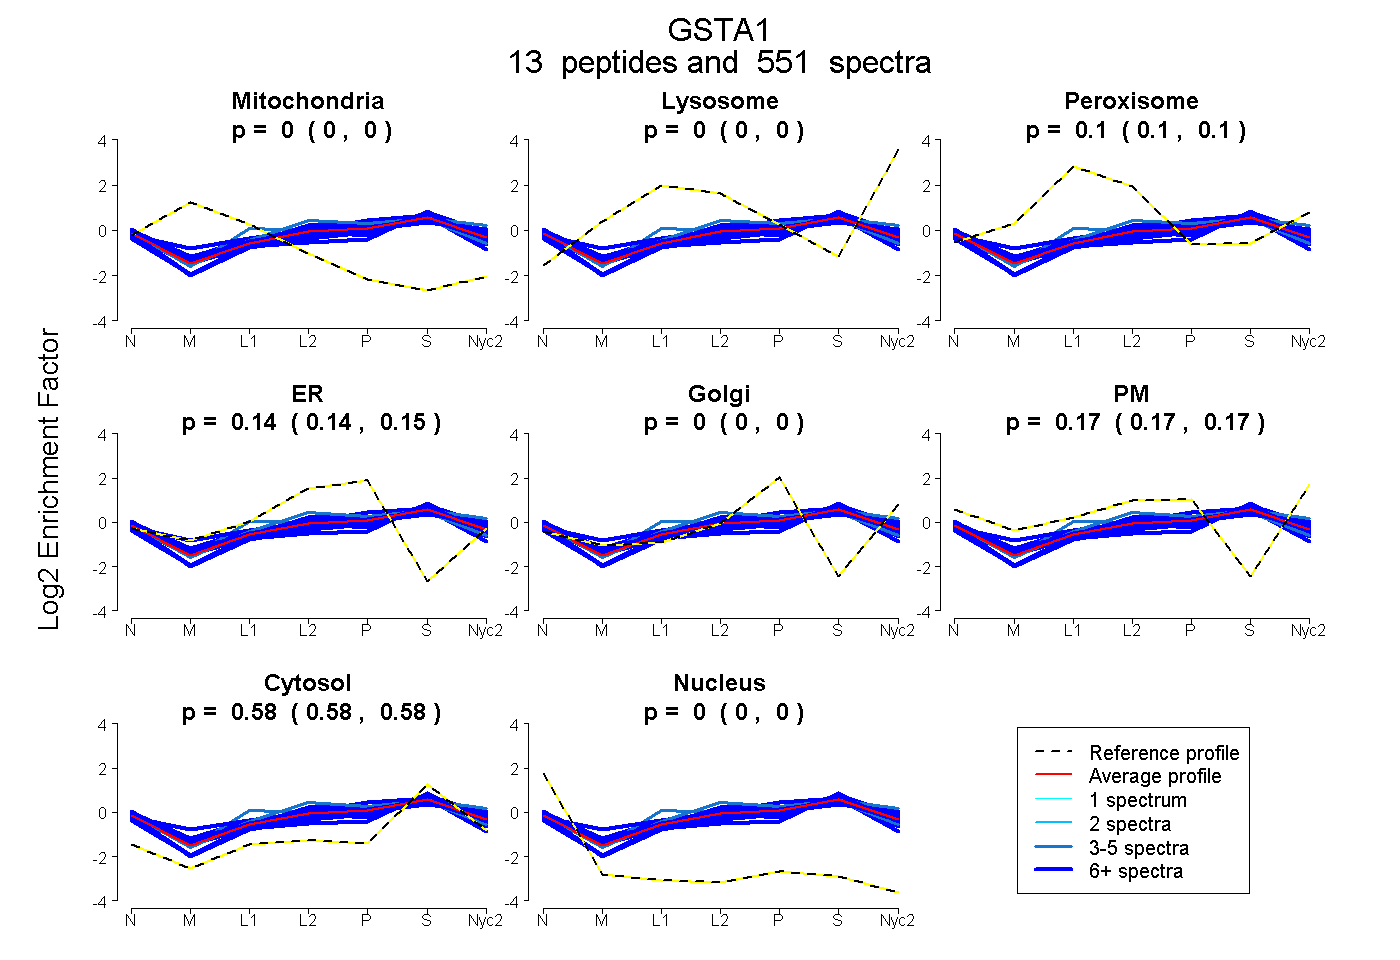
| Expt A |
13 peptides |
551 spectra |
|
0.000 0.000 | 0.000 |
0.000 0.000 | 0.000 |
0.099 0.098 | 0.100 |
0.145 0.143 | 0.147 |
0.000 0.000 | 0.000 |
0.172 0.169 | 0.174 |
0.584 0.584 | 0.585 |
0.000 0.000 | 0.000 |
| 26 spectra, CVESAVK | 0.000 | 0.000 | 0.085 | 0.315 | 0.000 | 0.000 | 0.600 | 0.000 | ||
| 3 spectra, MPGKPVLHYFDGR | 0.000 | 0.000 | 0.213 | 0.238 | 0.000 | 0.011 | 0.532 | 0.005 | ||
| 44 spectra, AILNYIATK | 0.000 | 0.000 | 0.071 | 0.061 | 0.000 | 0.147 | 0.720 | 0.000 | ||
| 57 spectra, YFPAFEK | 0.000 | 0.000 | 0.099 | 0.159 | 0.000 | 0.181 | 0.561 | 0.000 | ||
| 44 spectra, YNLYGK | 0.000 | 0.000 | 0.028 | 0.121 | 0.000 | 0.173 | 0.677 | 0.000 | ||
| 22 spectra, EASLAK | 0.000 | 0.000 | 0.134 | 0.121 | 0.000 | 0.211 | 0.535 | 0.000 | ||
| 5 spectra, WLLAAAGVEFEEQFLK | 0.000 | 0.000 | 0.124 | 0.097 | 0.000 | 0.273 | 0.506 | 0.000 | ||
| 52 spectra, KPLEDEK | 0.000 | 0.000 | 0.046 | 0.341 | 0.000 | 0.011 | 0.601 | 0.000 | ||
| 32 spectra, VSNLPTVK | 0.000 | 0.000 | 0.073 | 0.152 | 0.000 | 0.227 | 0.548 | 0.000 | ||
| 15 spectra, NDGSLMFQQVPMVEIDGMK | 0.000 | 0.000 | 0.192 | 0.007 | 0.072 | 0.243 | 0.487 | 0.000 | ||
| 49 spectra, PGKPVLHYFDGR | 0.000 | 0.000 | 0.099 | 0.143 | 0.000 | 0.244 | 0.514 | 0.000 | ||
| 114 spectra, FLQPGSQR | 0.000 | 0.000 | 0.107 | 0.016 | 0.000 | 0.252 | 0.624 | 0.000 | ||
| 88 spectra, SHGQDYLVGNR | 0.000 | 0.000 | 0.103 | 0.075 | 0.000 | 0.212 | 0.610 | 0.000 |
| Plot | Mito | Lyso or Perox | ER | Golgi | PM | Cytosol | Nucleus | ||||||
| Expt B |
6 peptides |
53 spectra |
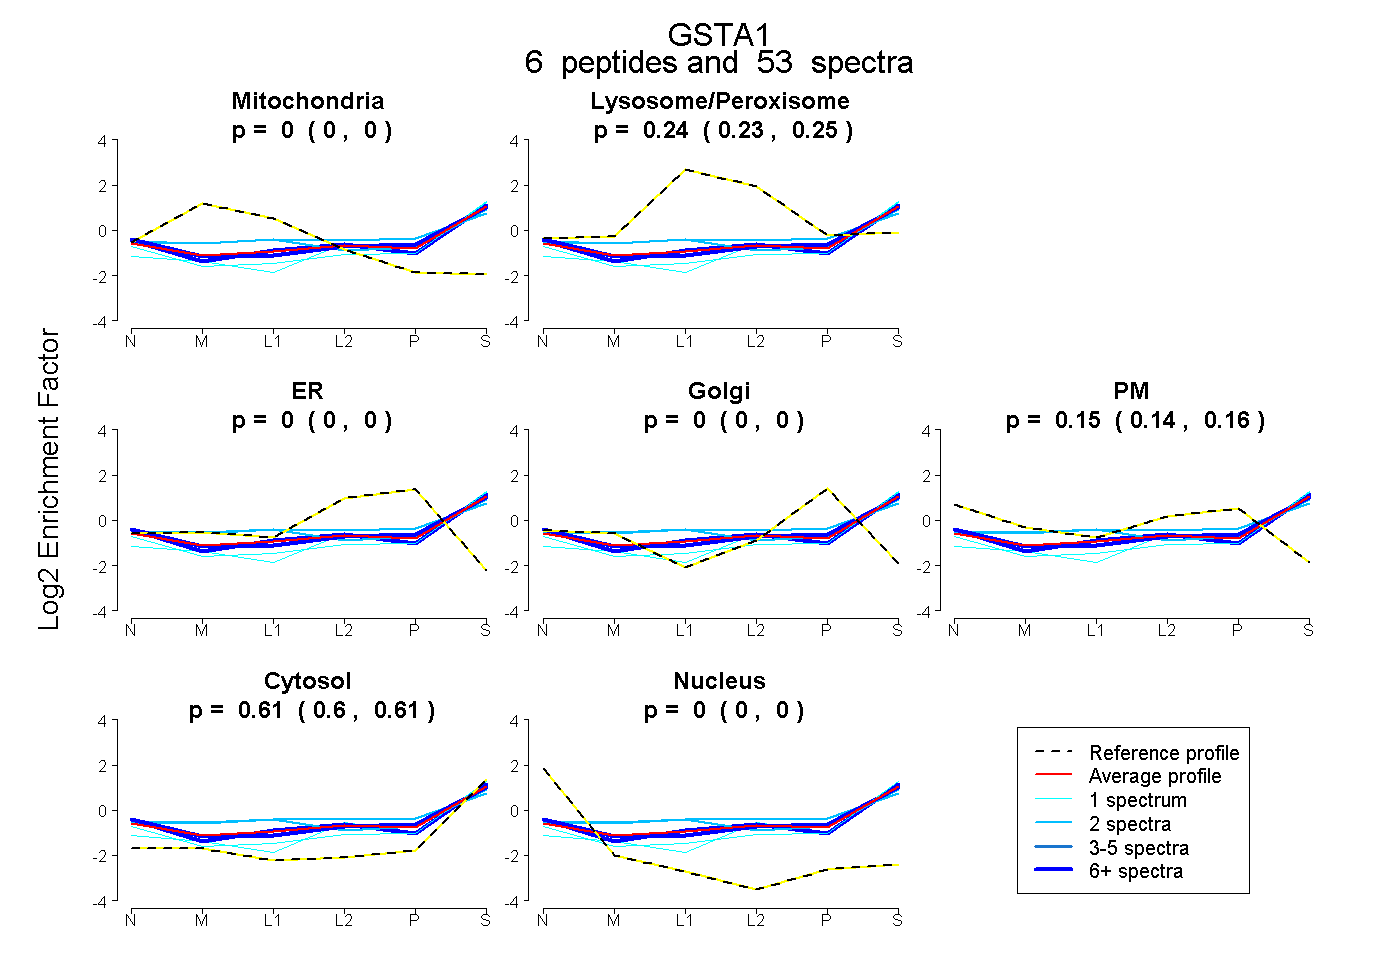 |
0.000 0.000 | 0.000 |
0.241 0.235 | 0.246 |
0.000 0.000 | 0.000 |
0.000 0.000 | 0.000 |
0.152 0.145 | 0.158 |
0.607 0.602 | 0.611 |
0.000 0.000 | 0.000 |
|||
| Plot | Lyso | Other | |||||||||||
| Expt C |
12 peptides |
927 spectra |
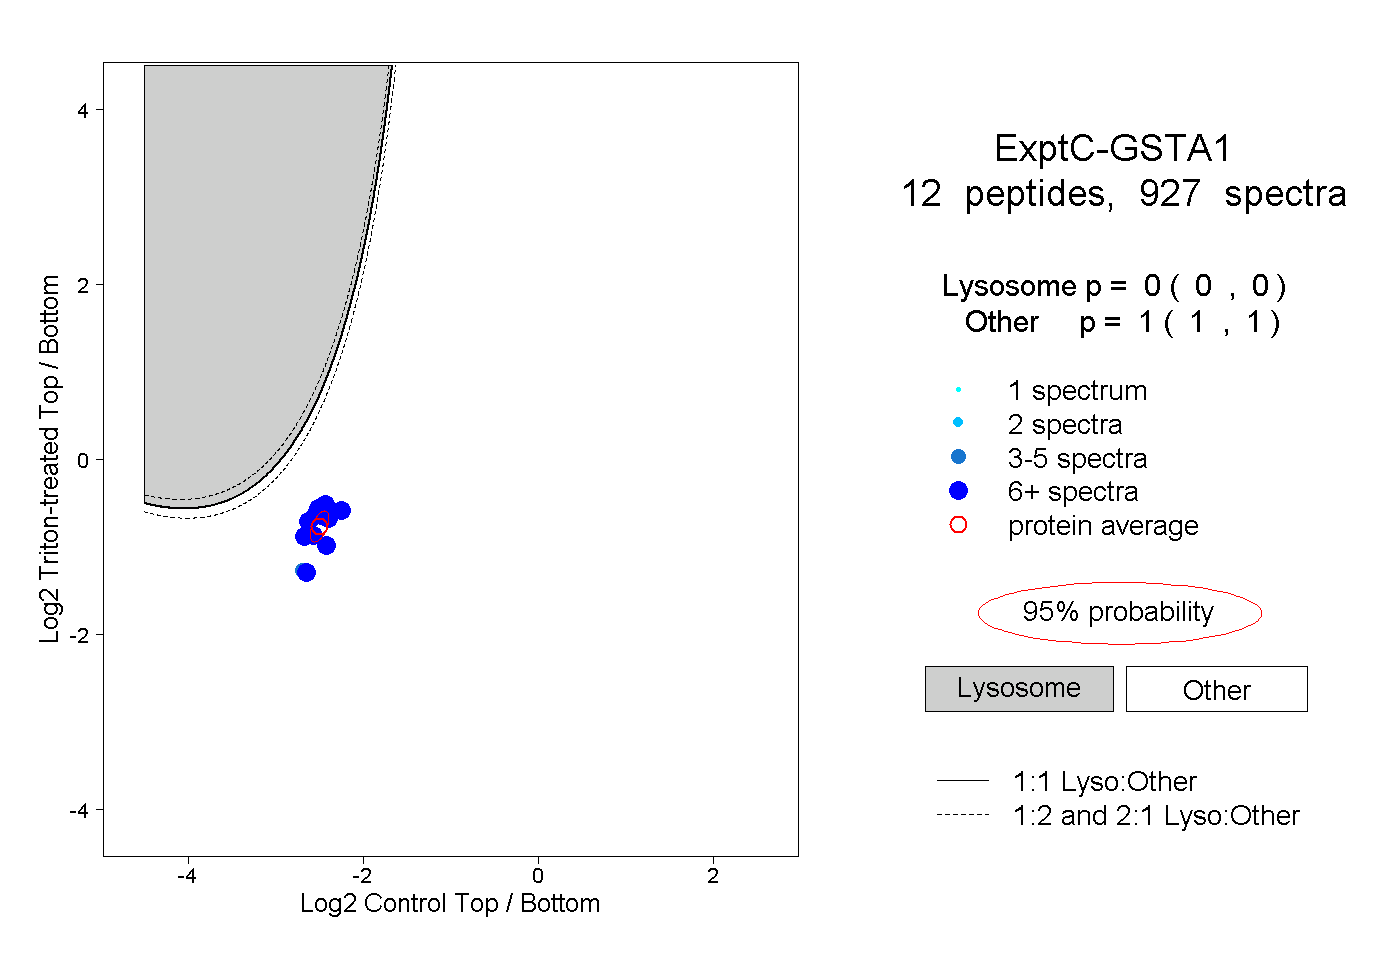 |
0.000 0.000 | 0.000 |
1.000 1.000 | 1.000 |
||||||||
| Plot | Lyso | Other | |||||||||||
| Expt D |
8 peptides |
67 spectra |
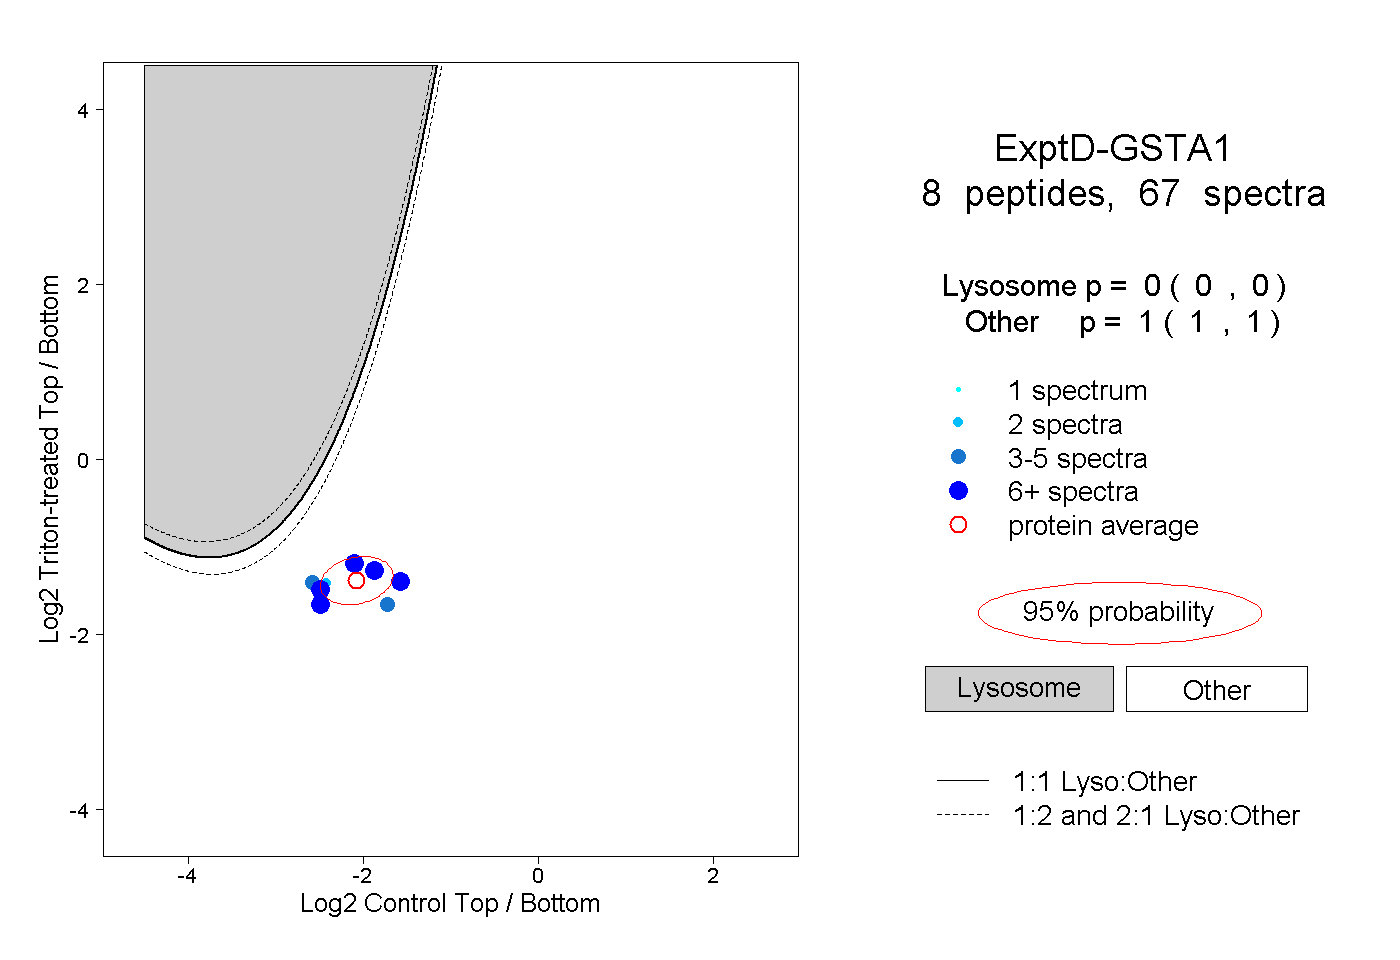 |
0.000 0.000 | 0.000 |
1.000 1.000 | 1.000 |