 7
7peptides
spectra
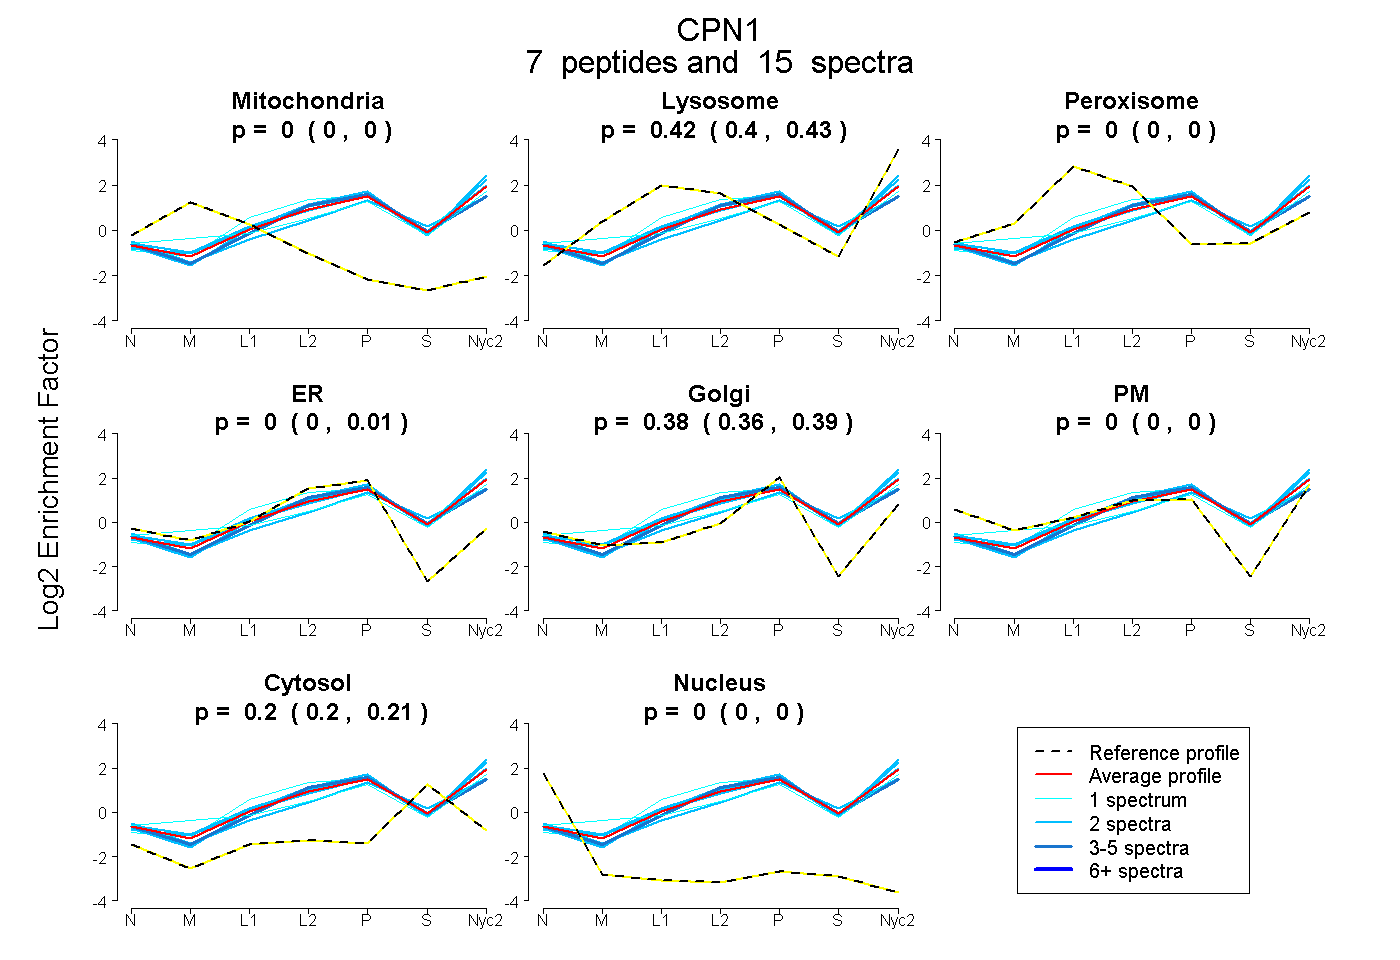
0.000 | 0.000
0.405 | 0.427
0.000 | 0.000
0.000 | 0.012
0.363 | 0.387
0.000 | 0.000
0.196 | 0.209
0.000 | 0.000
1peptide
spectrum
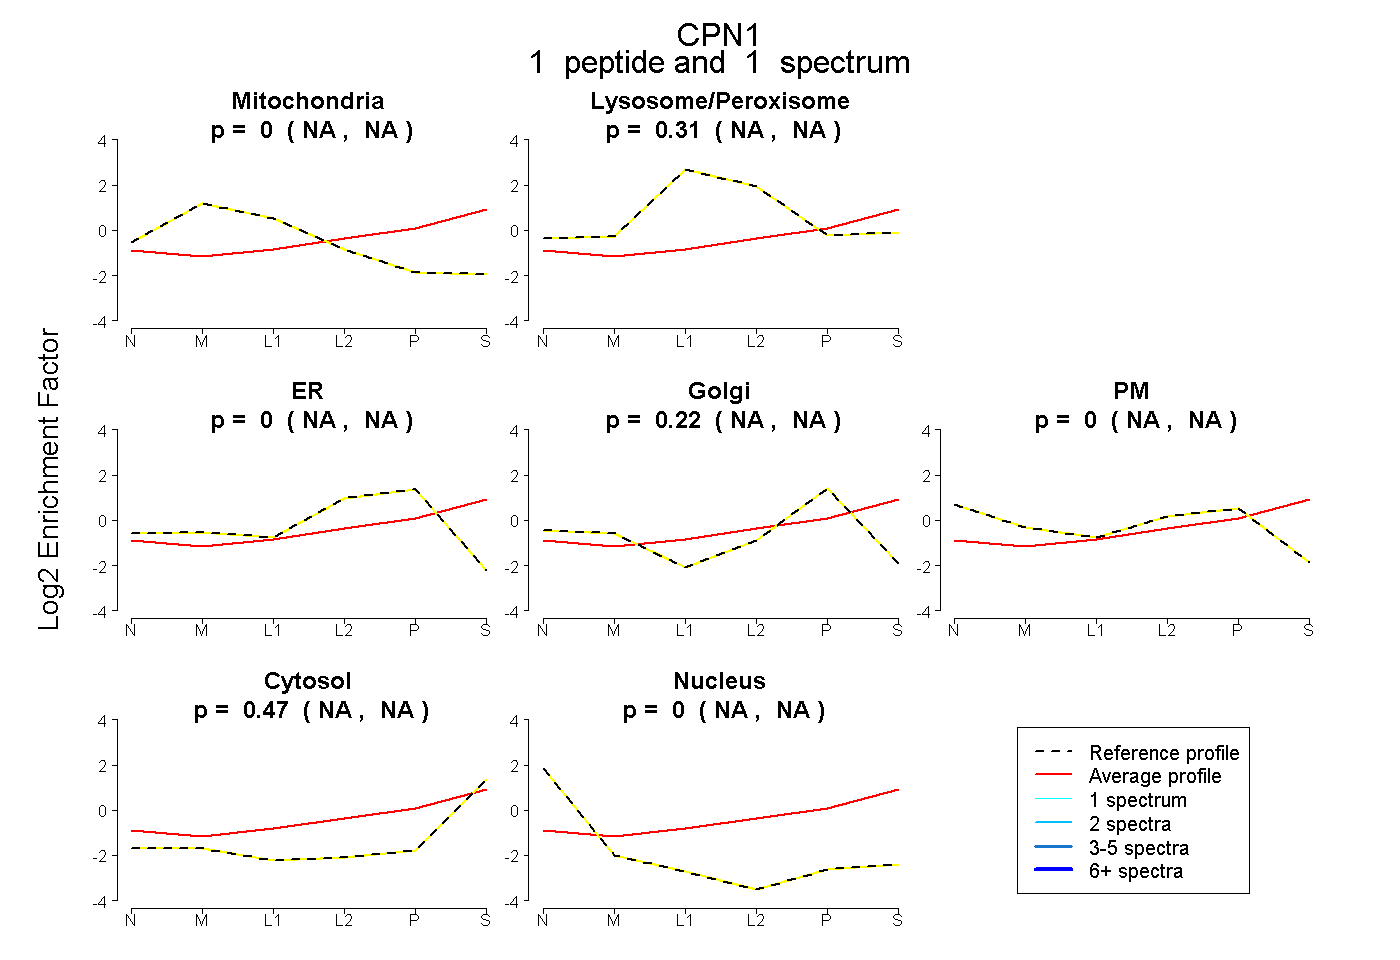
NA | NA
NA | NA
NA | NA
NA | NA
NA | NA
NA | NA
NA | NA
7peptides
spectra
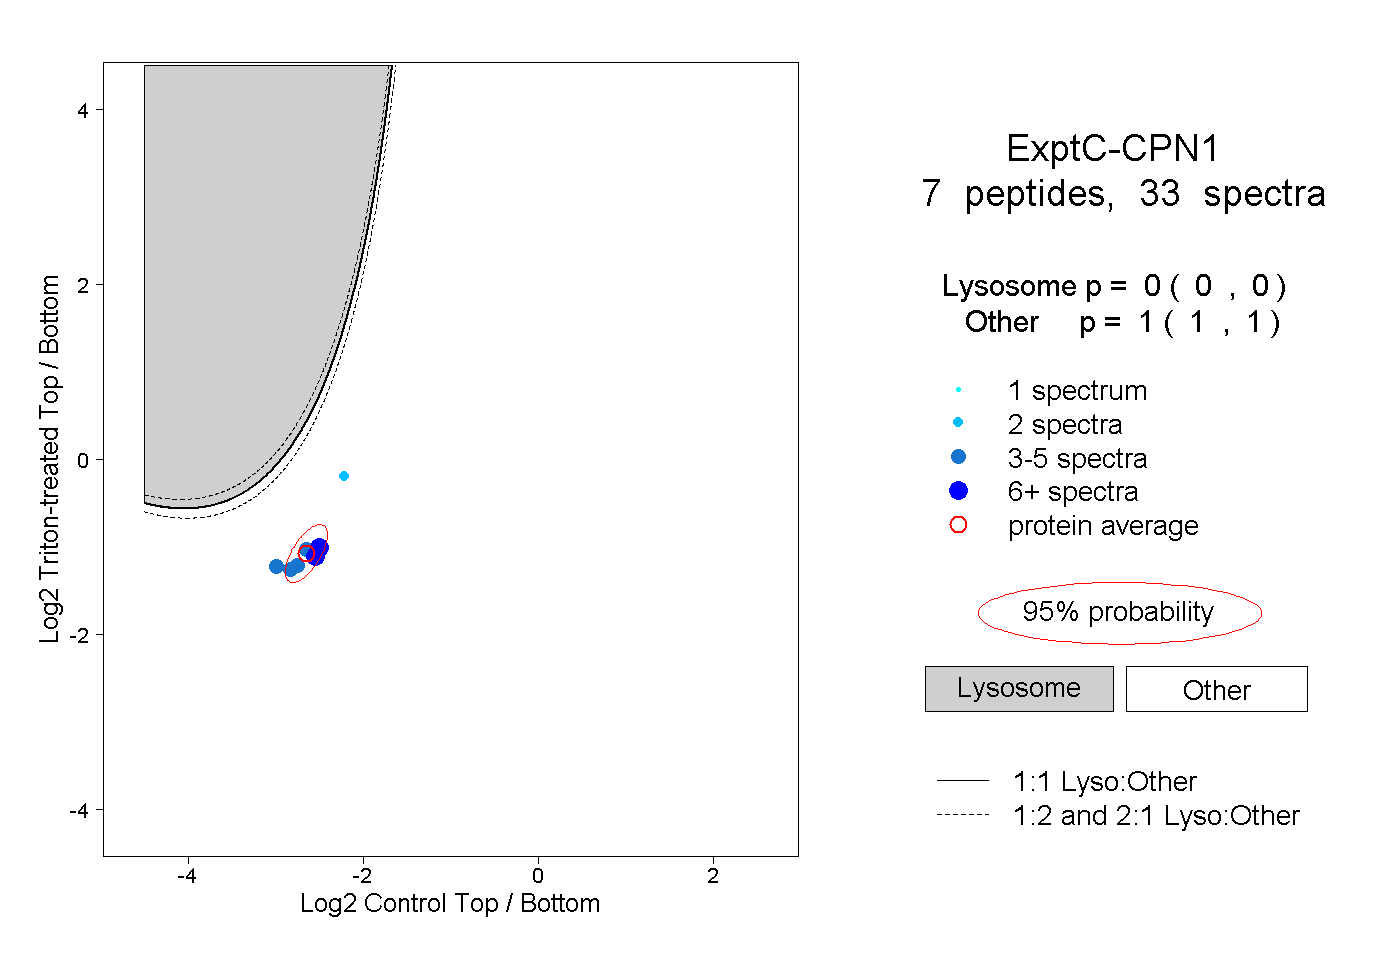
0.000 | 0.000
1.000 | 1.000
1peptide
spectra
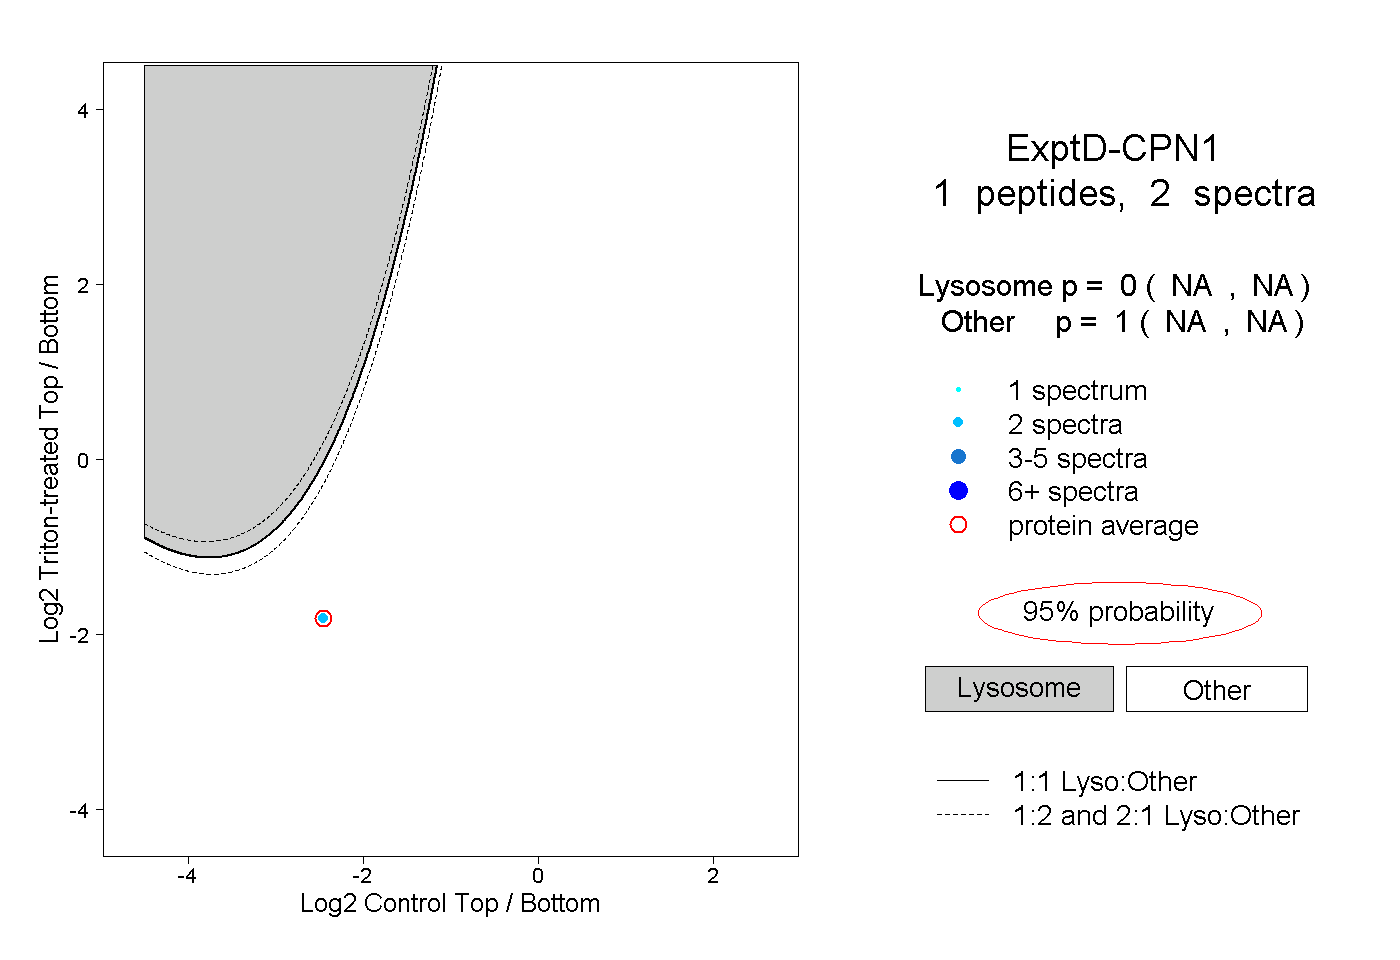
NA | NA
NA | NA