 7
7peptides
spectra
0.000 | 0.000
0.405 | 0.427
0.000 | 0.000
0.000 | 0.012
0.363 | 0.387
0.000 | 0.000
0.196 | 0.209
0.000 | 0.000
| Plot | Mito | Lyso | Perox | ER | Golgi | PM | Cytosol | Nucleus | |||||
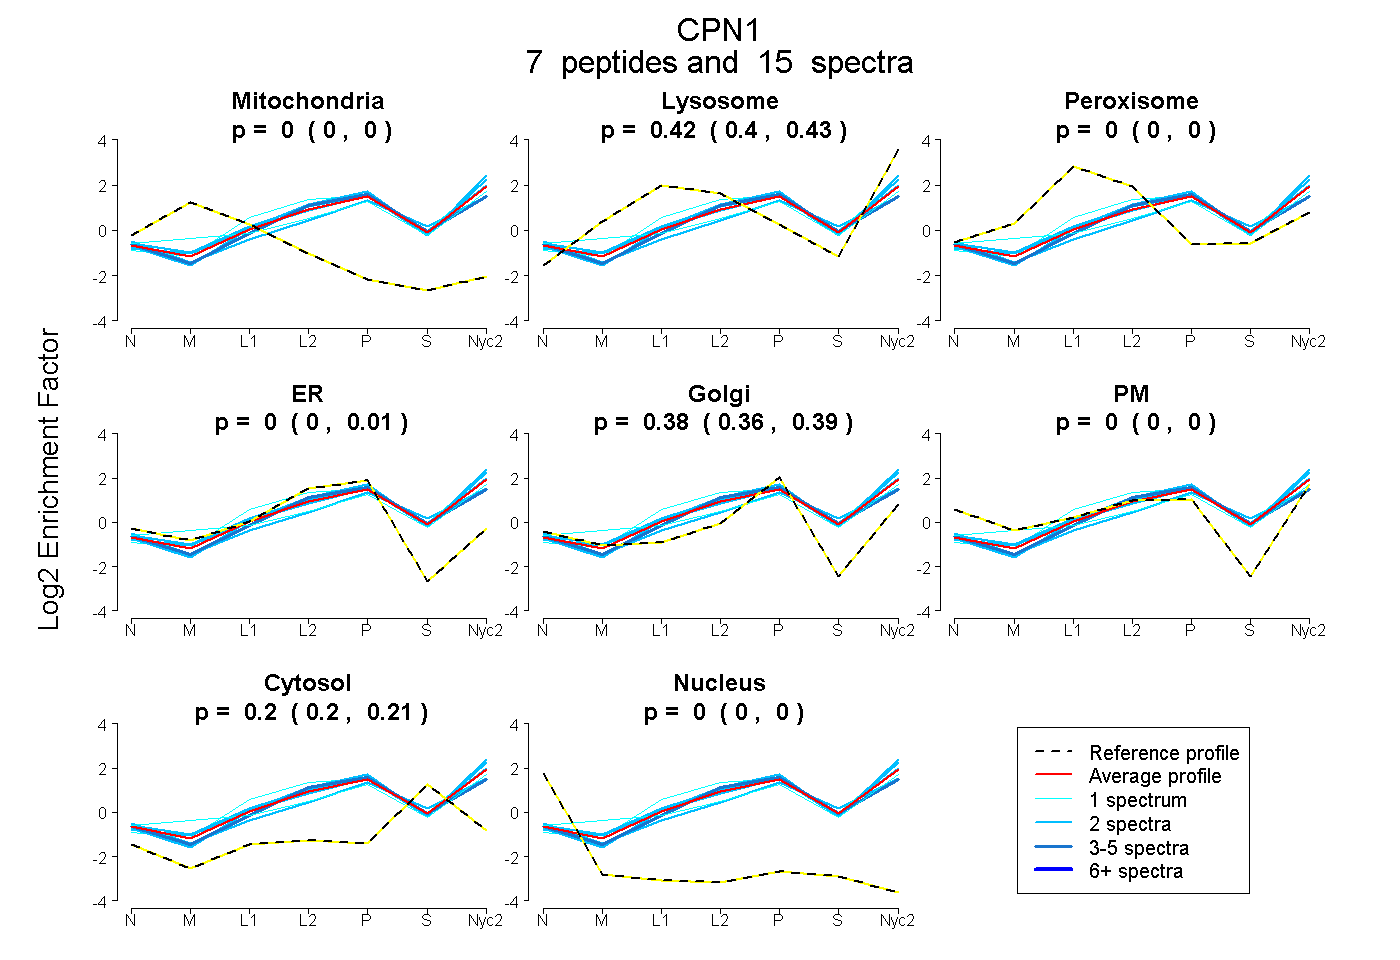
| Expt A |
7 peptides |
15 spectra |
|
0.000 0.000 | 0.000 |
0.417 0.405 | 0.427 |
0.000 0.000 | 0.000 |
0.000 0.000 | 0.012 |
0.380 0.363 | 0.387 |
0.000 0.000 | 0.000 |
0.203 0.196 | 0.209 |
0.000 0.000 | 0.000 |
| 1 spectrum, EALIQFLEQVHQGIK | 0.000 | 0.536 | 0.000 | 0.089 | 0.203 | 0.000 | 0.171 | 0.000 | ||
| 2 spectra, SQVEPETR | 0.000 | 0.432 | 0.000 | 0.000 | 0.369 | 0.000 | 0.199 | 0.000 | ||
| 5 spectra, YDDLVR | 0.000 | 0.327 | 0.000 | 0.166 | 0.266 | 0.000 | 0.241 | 0.000 | ||
| 2 spectra, EWLGNR | 0.000 | 0.432 | 0.000 | 0.000 | 0.402 | 0.000 | 0.166 | 0.000 | ||
| 2 spectra, LYNIGR | 0.000 | 0.489 | 0.000 | 0.000 | 0.369 | 0.000 | 0.142 | 0.000 | ||
| 2 spectra, AVIQWIR | 0.000 | 0.295 | 0.000 | 0.000 | 0.401 | 0.000 | 0.304 | 0.000 | ||
| 1 spectrum, YGGPNHHLPLPDNWK | 0.000 | 0.386 | 0.000 | 0.000 | 0.380 | 0.029 | 0.205 | 0.000 |
| Plot | Mito | Lyso or Perox | ER | Golgi | PM | Cytosol | Nucleus | ||||||
| Expt B |
1 peptide |
1 spectrum |
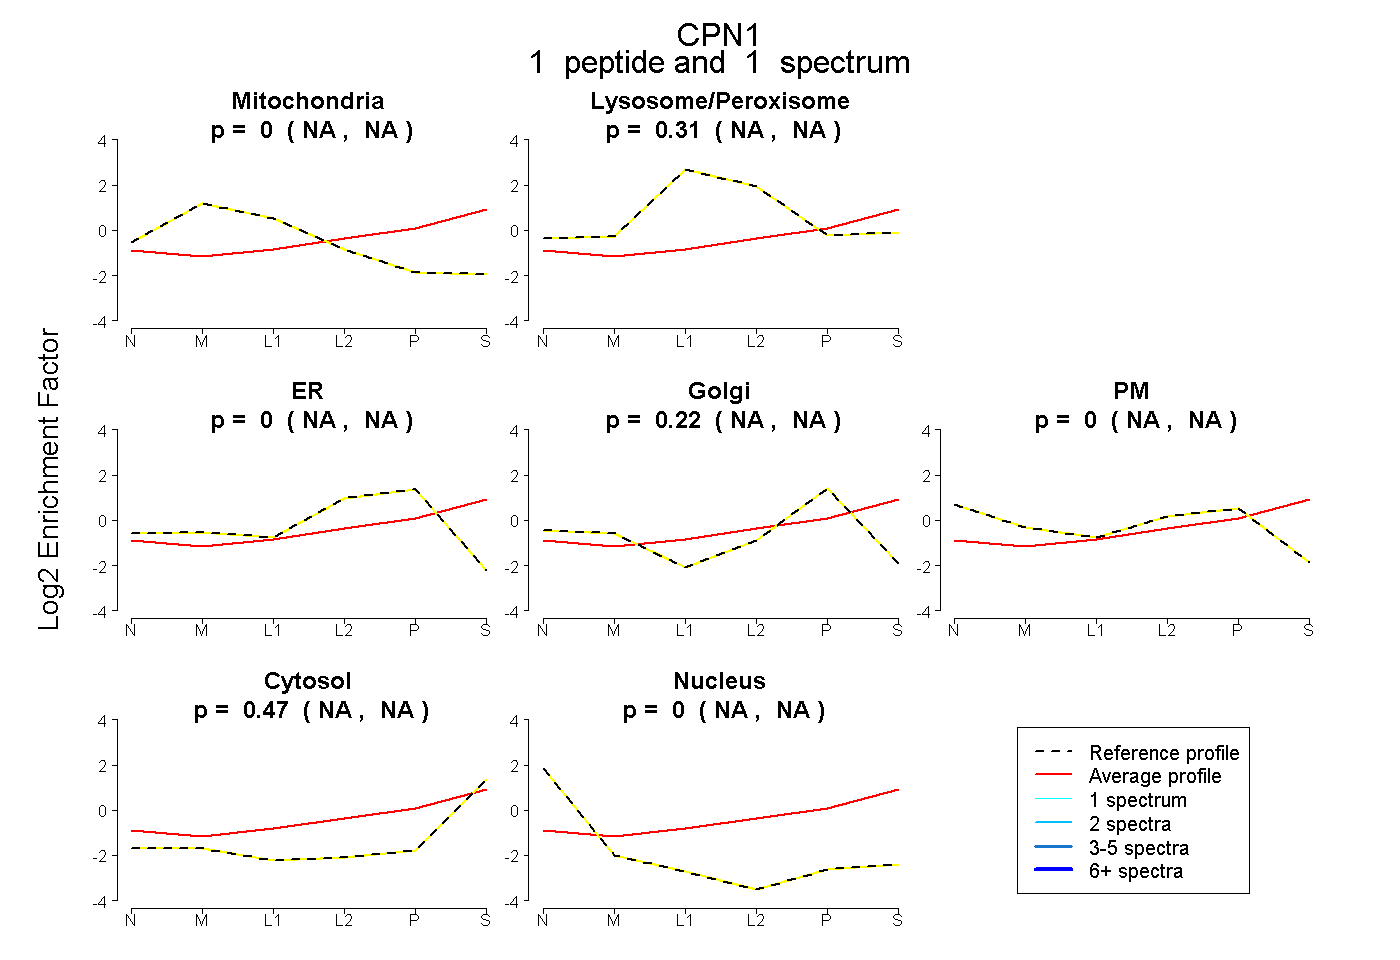 |
0.000 NA | NA |
0.310 NA | NA |
0.000 NA | NA |
0.221 NA | NA |
0.000 NA | NA |
0.469 NA | NA |
0.000 NA | NA |
|||
| Plot | Lyso | Other | |||||||||||
| Expt C |
7 peptides |
33 spectra |
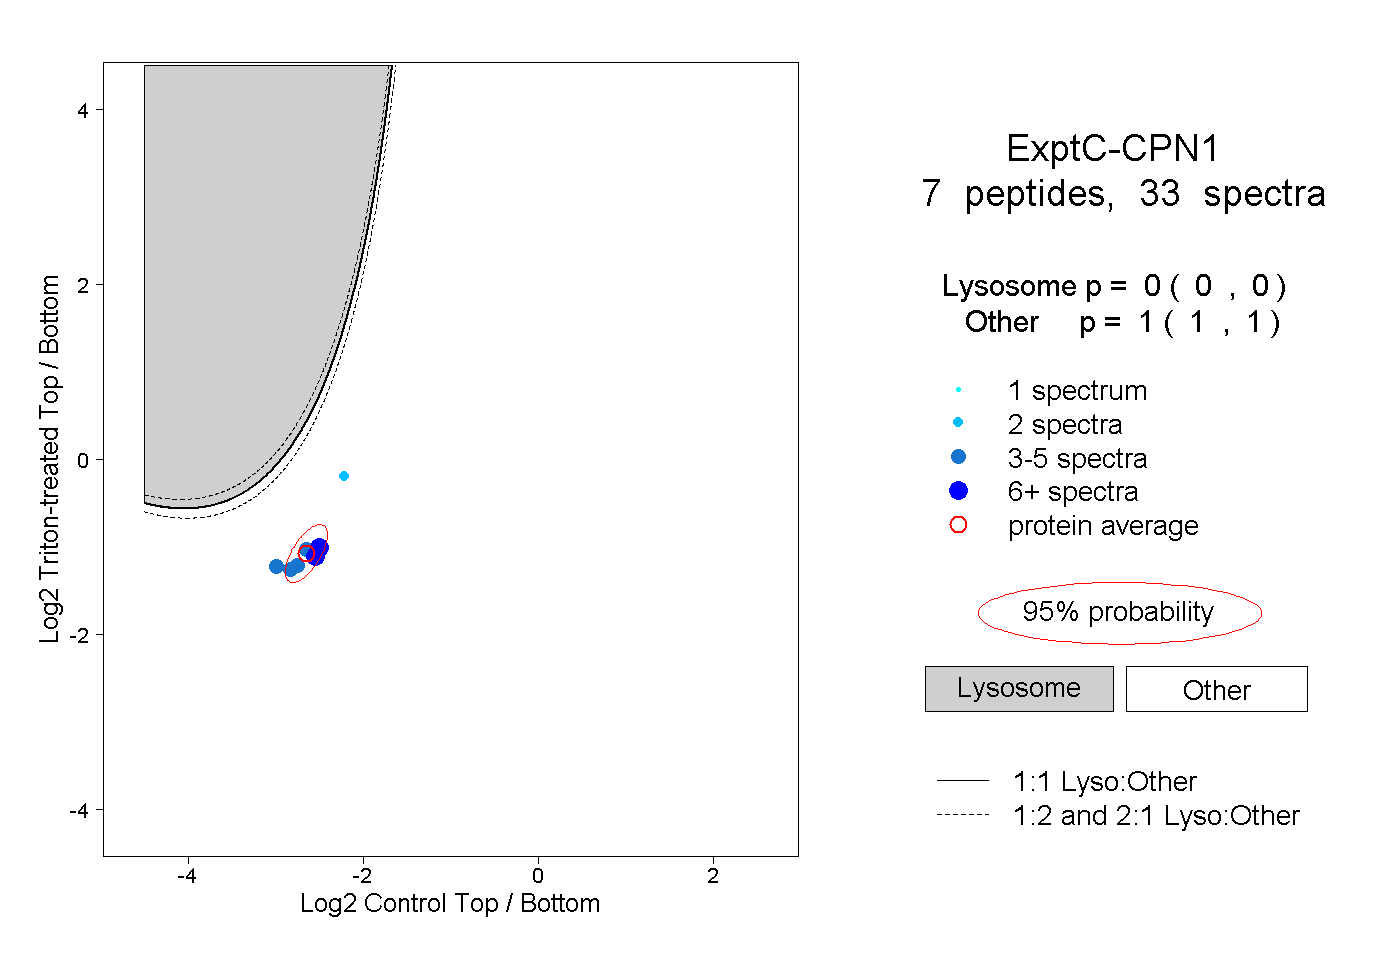 |
0.000 0.000 | 0.000 |
1.000 1.000 | 1.000 |
||||||||
| Plot | Lyso | Other | |||||||||||
| Expt D |
1 peptide |
2 spectra |
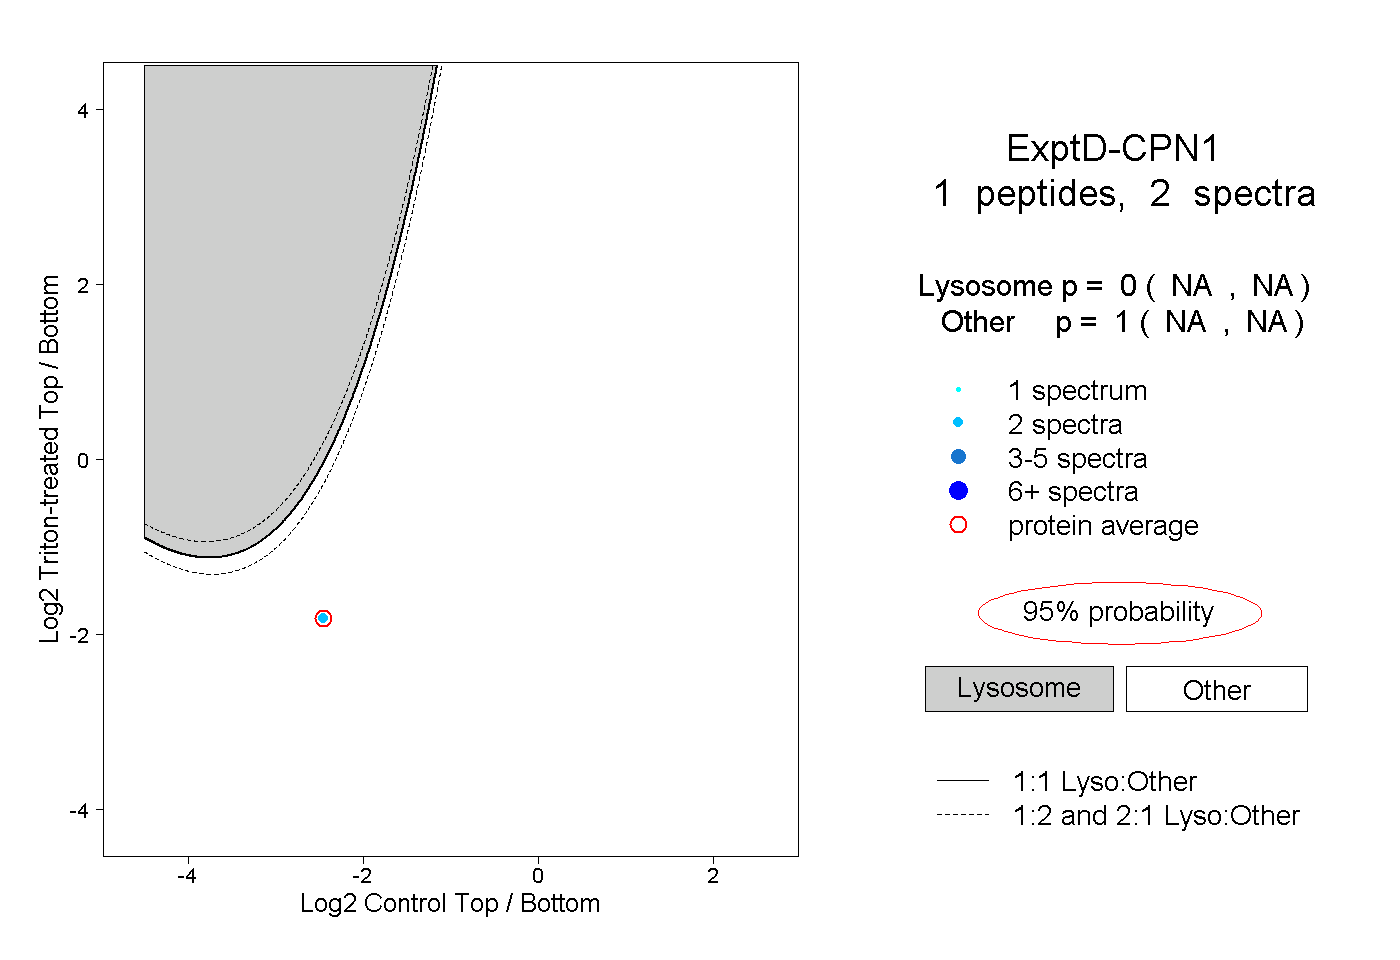 |
0.000 NA | NA |
1.000 NA | NA |