 5
5peptides
spectra
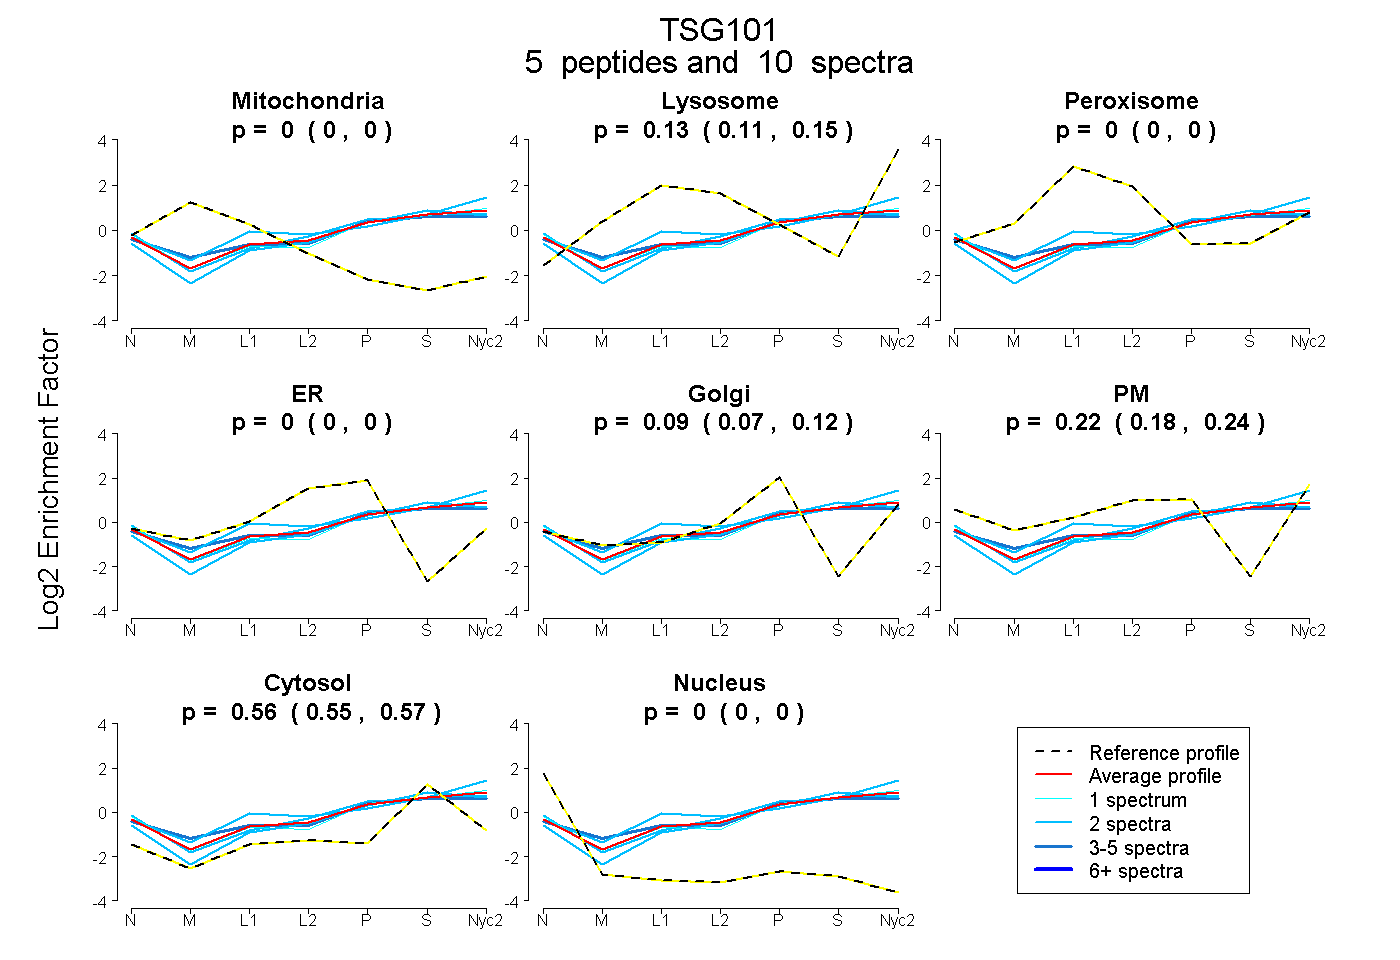
0.000 | 0.000
0.108 | 0.146
0.000 | 0.000
0.000 | 0.000
0.067 | 0.116
0.184 | 0.242
0.550 | 0.570
0.000 | 0.000
2peptides
spectra
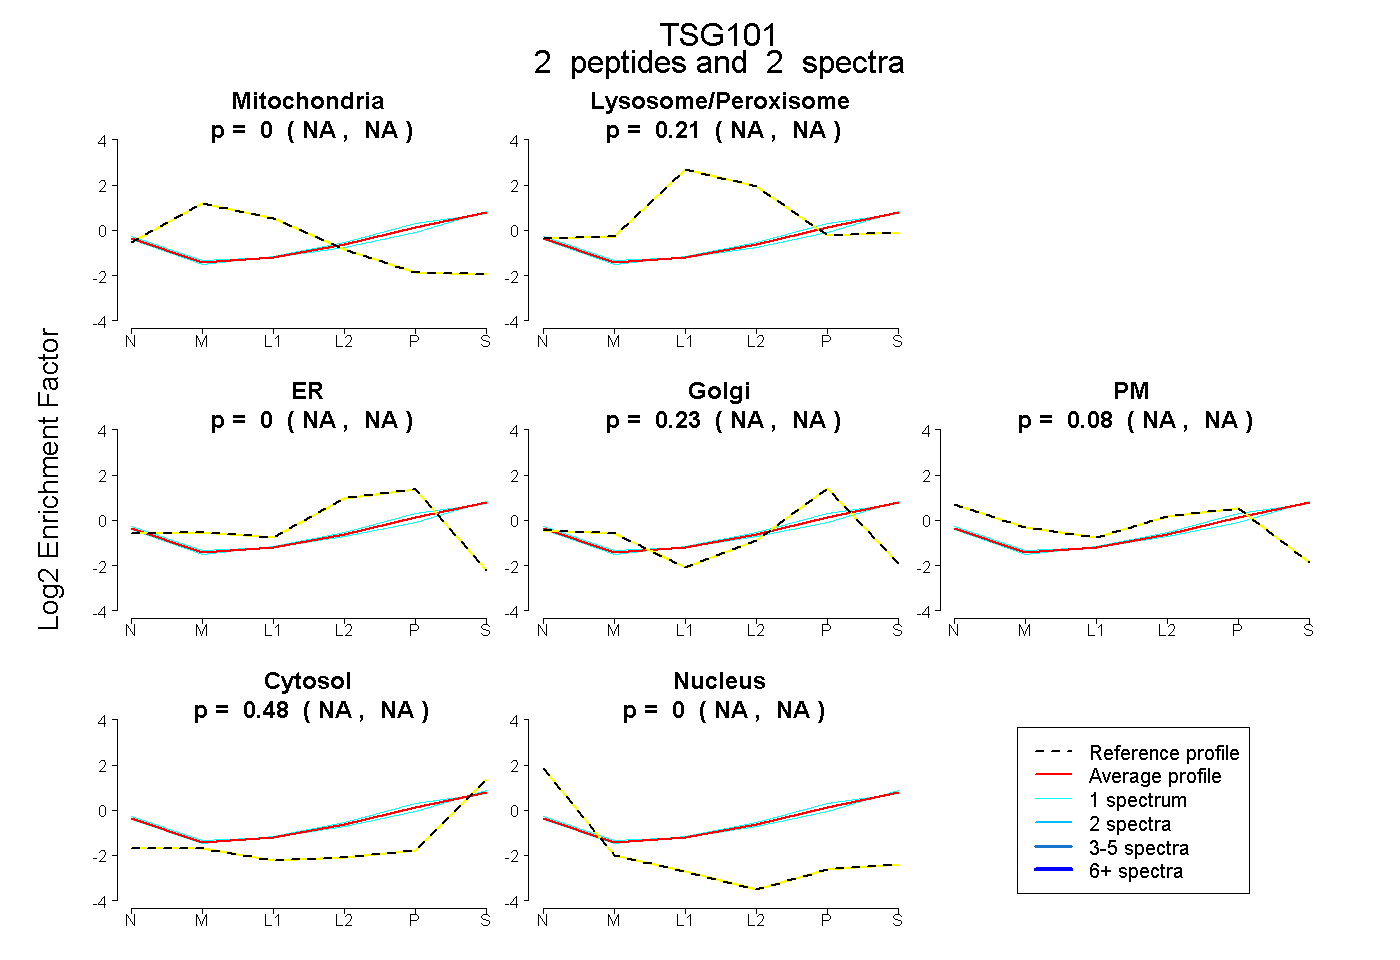
NA | NA
NA | NA
NA | NA
NA | NA
NA | NA
NA | NA
NA | NA
8peptides
spectra
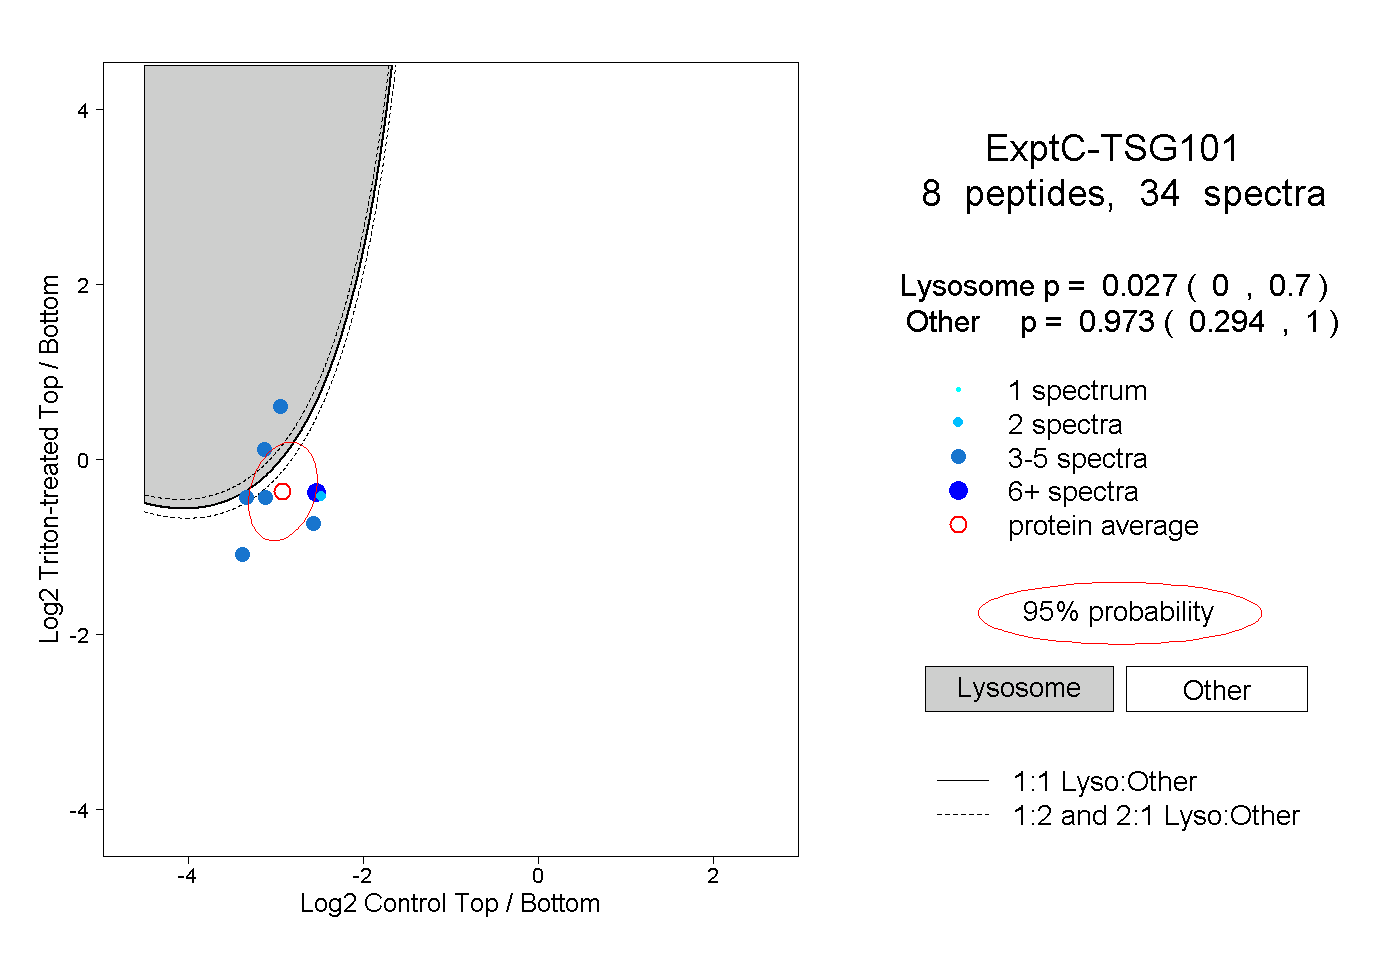
0.000 | 0.700
0.294 | 1.000