 5
5peptides
spectra
0.000 | 0.000
0.108 | 0.146
0.000 | 0.000
0.000 | 0.000
0.067 | 0.116
0.184 | 0.242
0.550 | 0.570
0.000 | 0.000
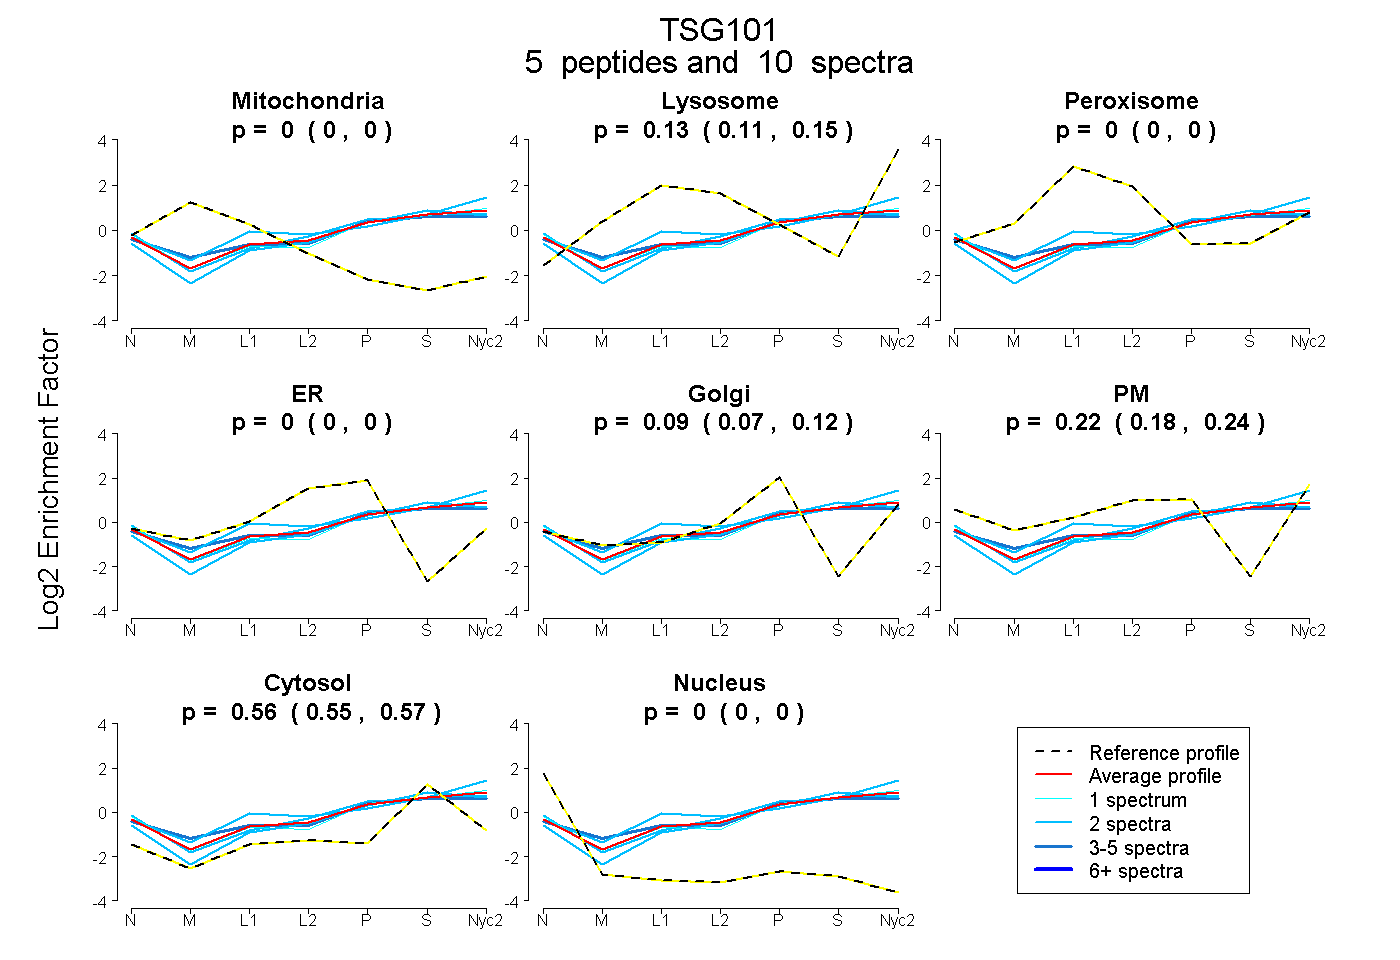
| Plot | Mito | Lyso | Perox | ER | Golgi | PM | Cytosol | Nucleus | |||||
| Expt A |
5 peptides |
10 spectra |
|
0.000 0.000 | 0.000 |
0.129 0.108 | 0.146 |
0.000 0.000 | 0.000 |
0.000 0.000 | 0.000 |
0.094 0.067 | 0.116 |
0.216 0.184 | 0.242 |
0.561 0.550 | 0.570 |
0.000 0.000 | 0.000 |
| 1 spectrum, LDQEVAEVDK | 0.000 | 0.093 | 0.000 | 0.000 | 0.113 | 0.230 | 0.564 | 0.000 | ||
| 3 spectra, GVIDLDVFLK | 0.000 | 0.132 | 0.000 | 0.000 | 0.151 | 0.175 | 0.543 | 0.000 | ||
| 2 spectra, LEEMVTR | 0.000 | 0.110 | 0.000 | 0.000 | 0.211 | 0.046 | 0.632 | 0.000 | ||
| 2 spectra, IYLPYLHDWK | 0.000 | 0.282 | 0.000 | 0.000 | 0.000 | 0.217 | 0.500 | 0.000 | ||
| 2 spectra, DGTISEDTIR | 0.000 | 0.046 | 0.000 | 0.000 | 0.089 | 0.311 | 0.554 | 0.000 |
| Plot | Mito | Lyso or Perox | ER | Golgi | PM | Cytosol | Nucleus | ||||||
| Expt B |
2 peptides |
2 spectra |
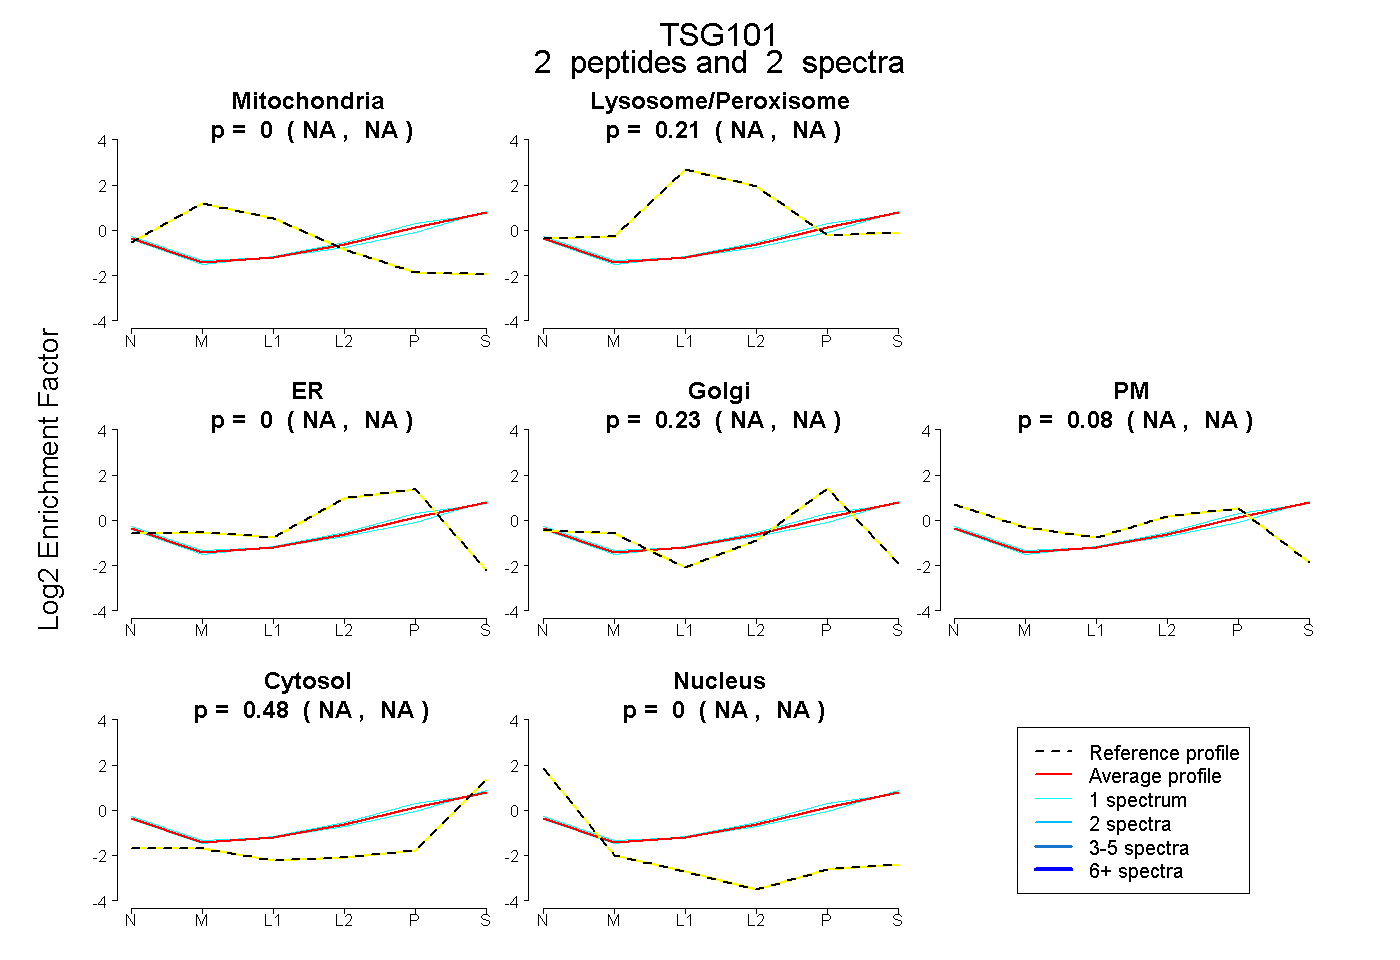 |
0.000 NA | NA |
0.210 NA | NA |
0.000 NA | NA |
0.228 NA | NA |
0.082 NA | NA |
0.479 NA | NA |
0.000 NA | NA |
|||
| Plot | Lyso | Other | |||||||||||
| Expt C |
8 peptides |
34 spectra |
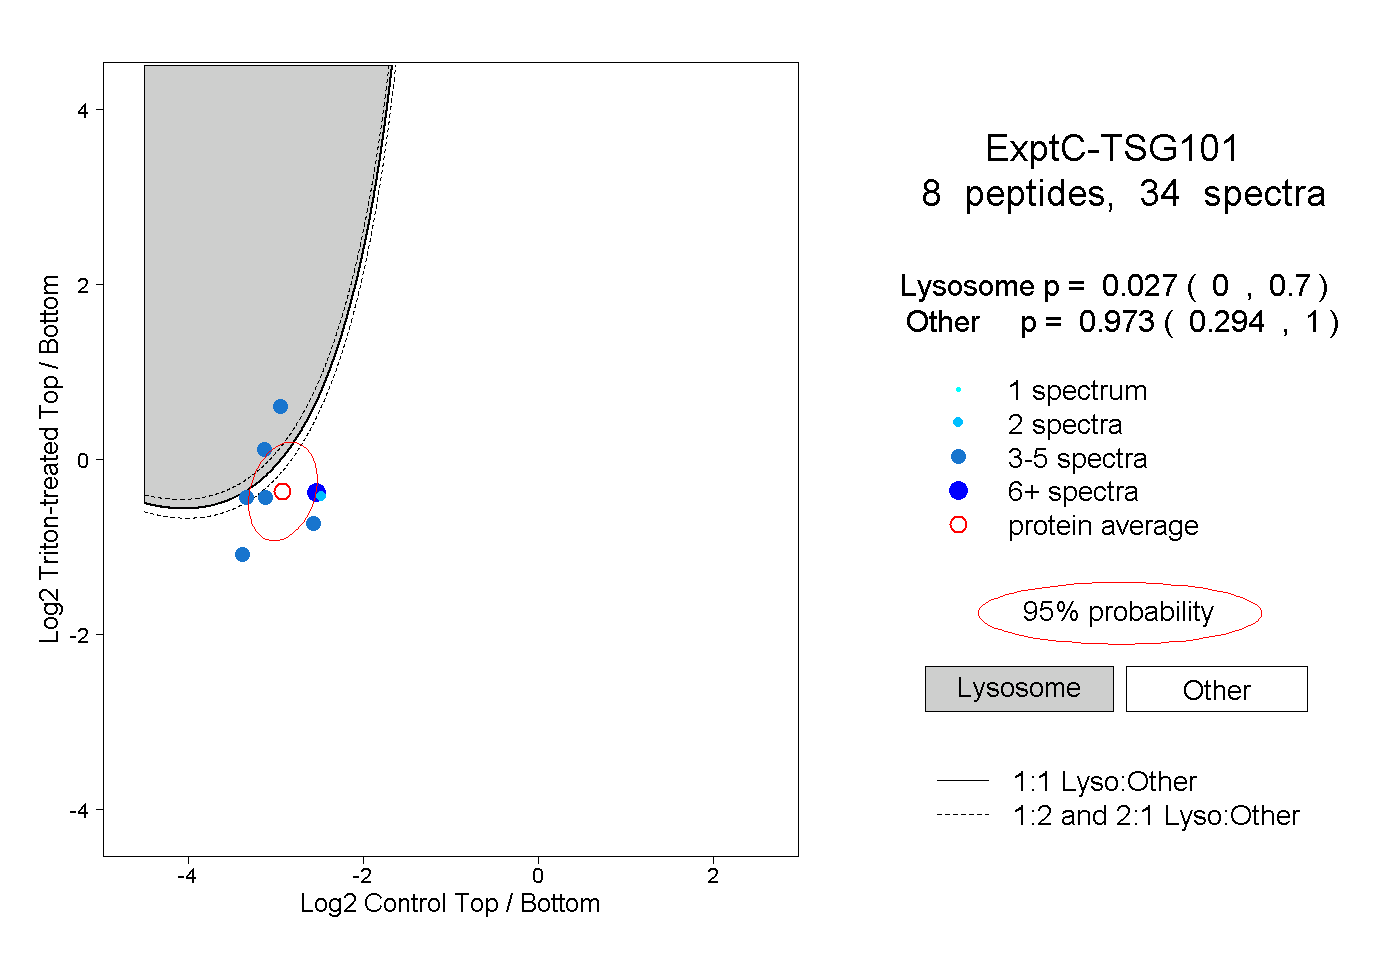 |
0.027 0.000 | 0.700 |
0.973 0.294 | 1.000 |