 11
11peptides
spectra
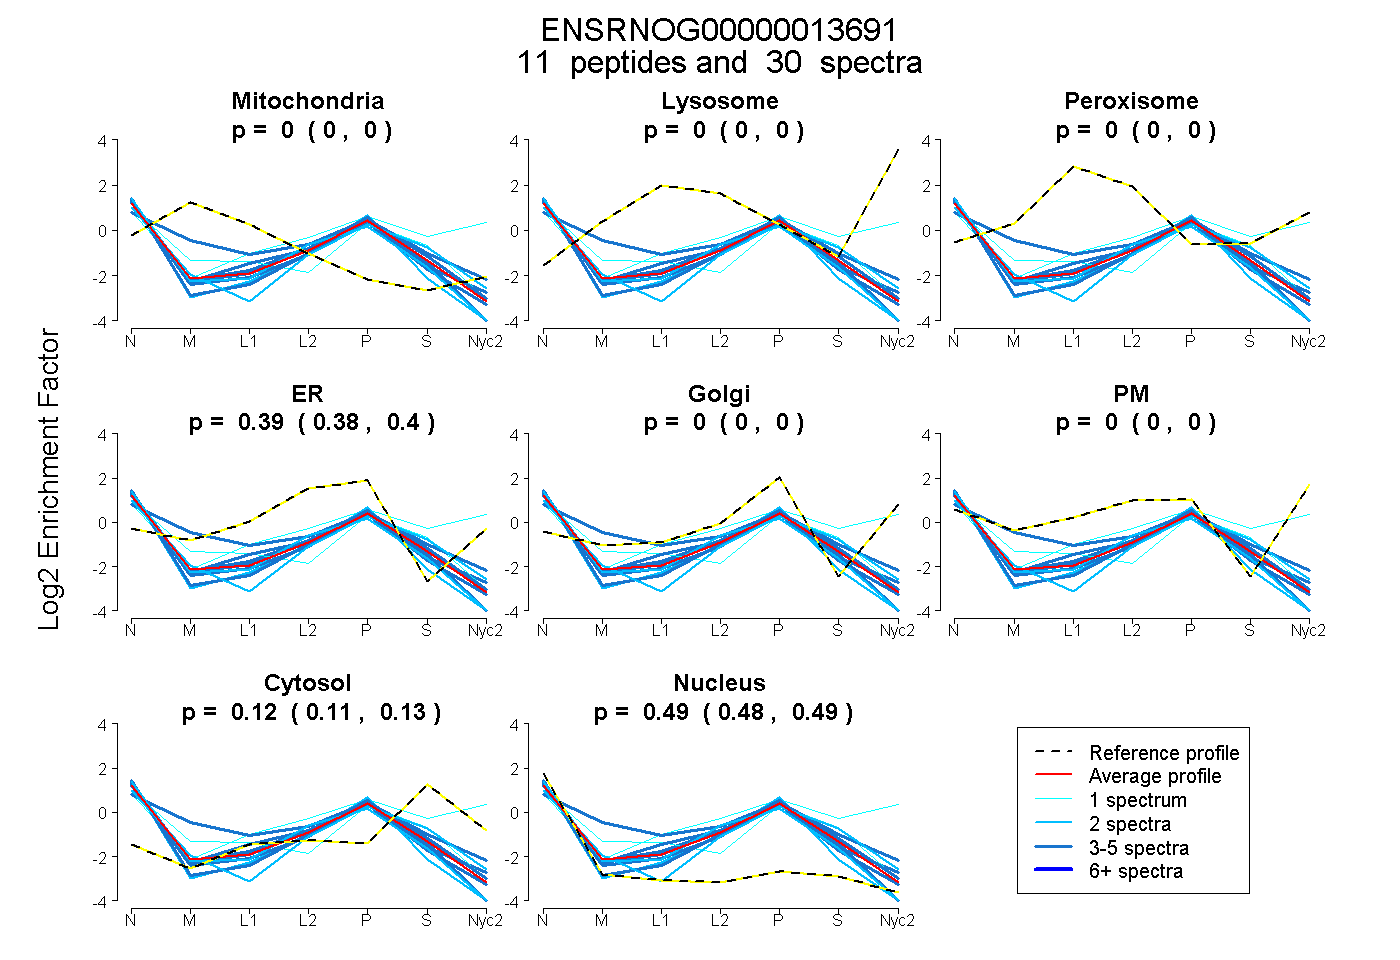
0.000 | 0.000
0.000 | 0.000
0.000 | 0.000
0.383 | 0.396
0.000 | 0.000
0.000 | 0.000
0.113 | 0.131
0.479 | 0.494
3peptides
spectra
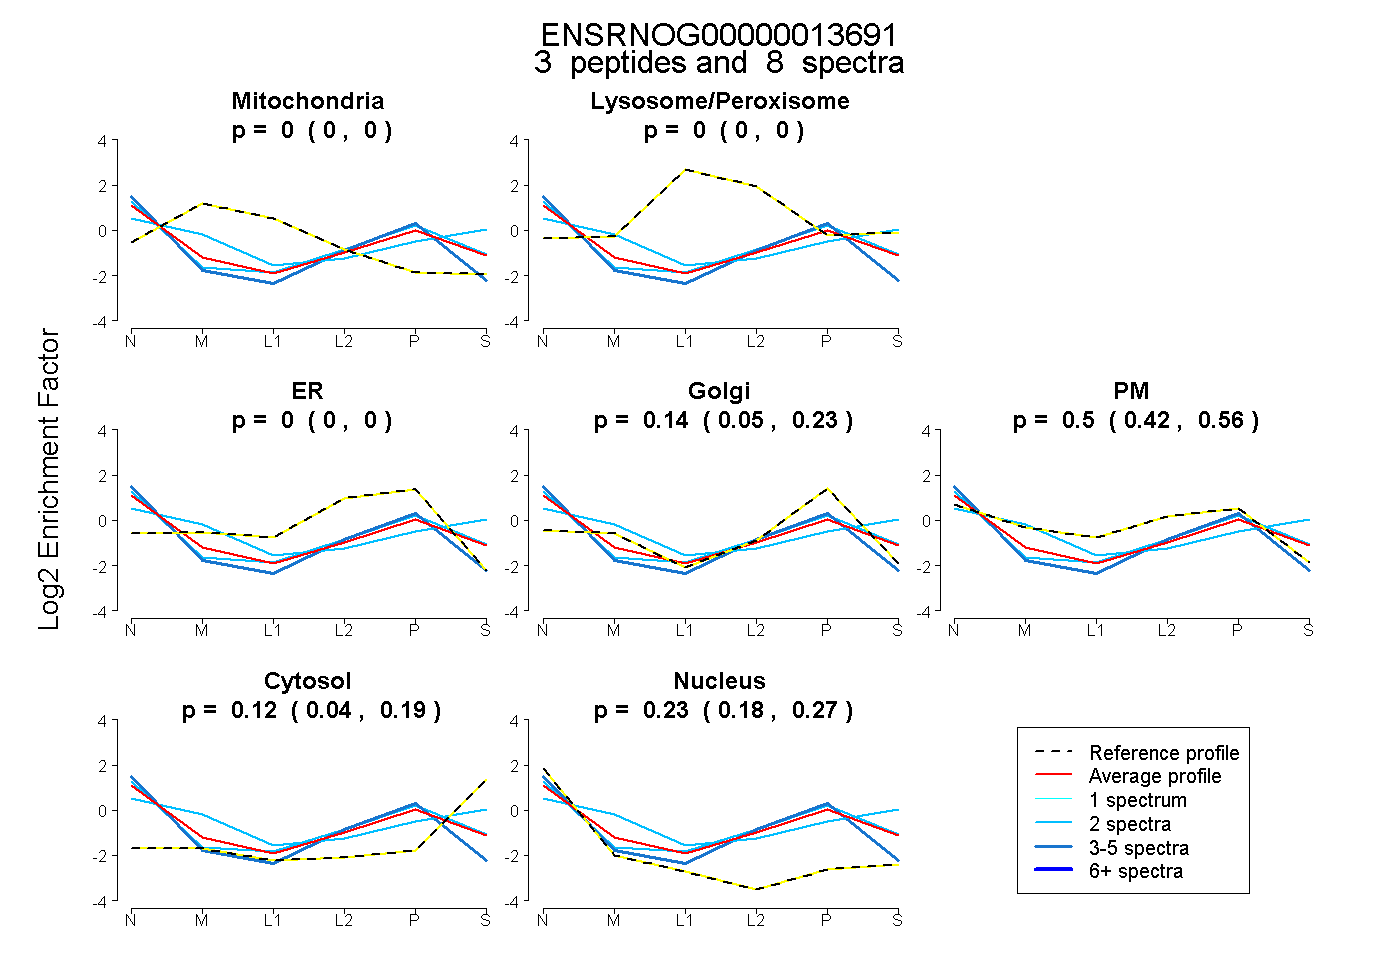
0.000 | 0.000
0.000 | 0.000
0.000 | 0.000
0.045 | 0.227
0.422 | 0.563
0.040 | 0.191
0.179 | 0.272
6peptides
spectra
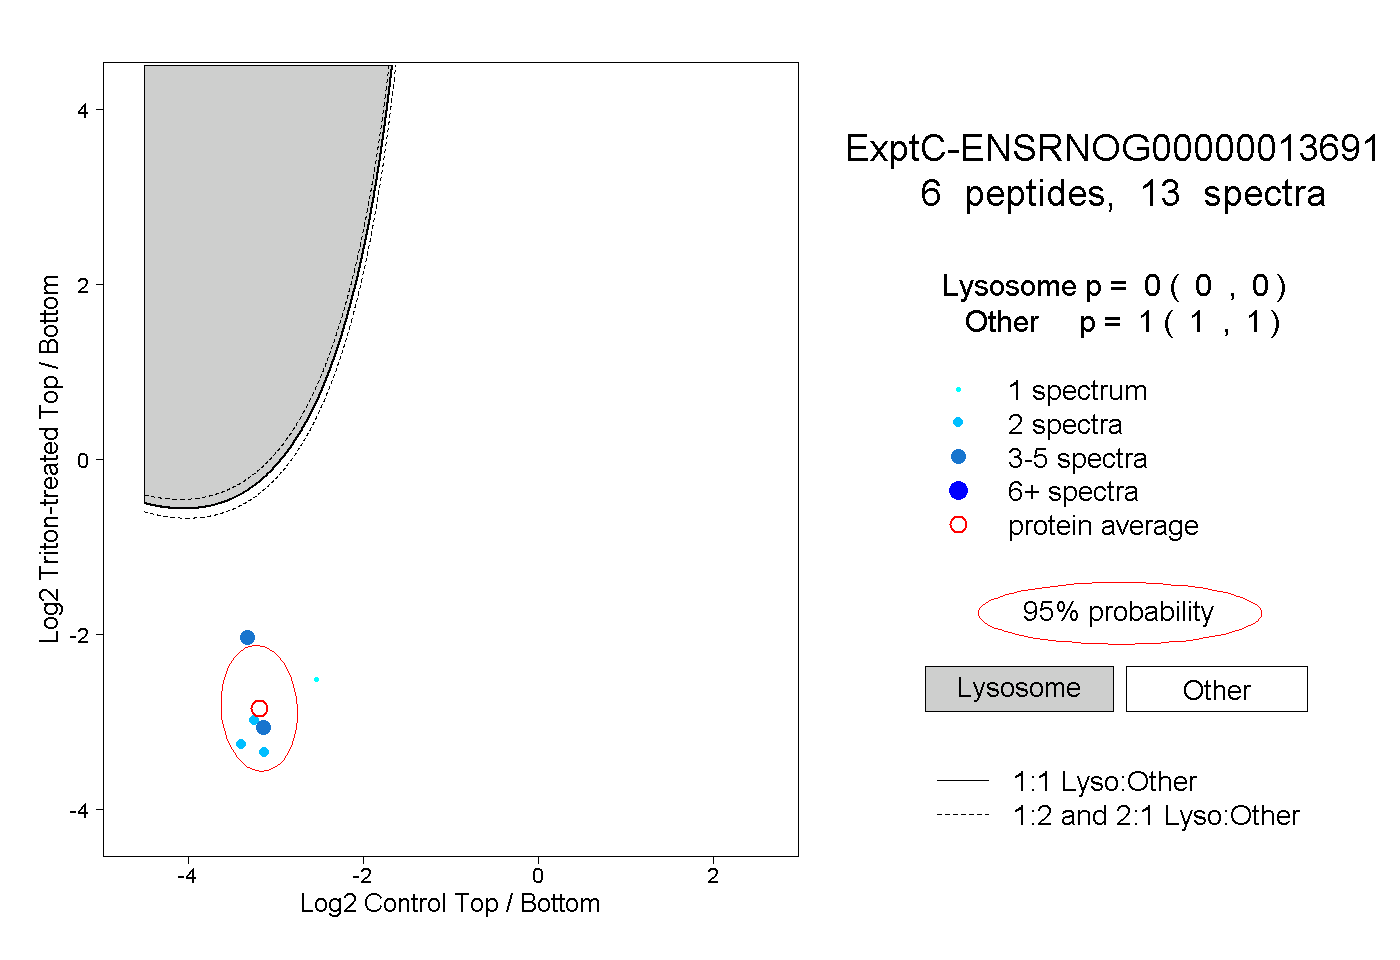
0.000 | 0.000
1.000 | 1.000
1peptide
spectrum
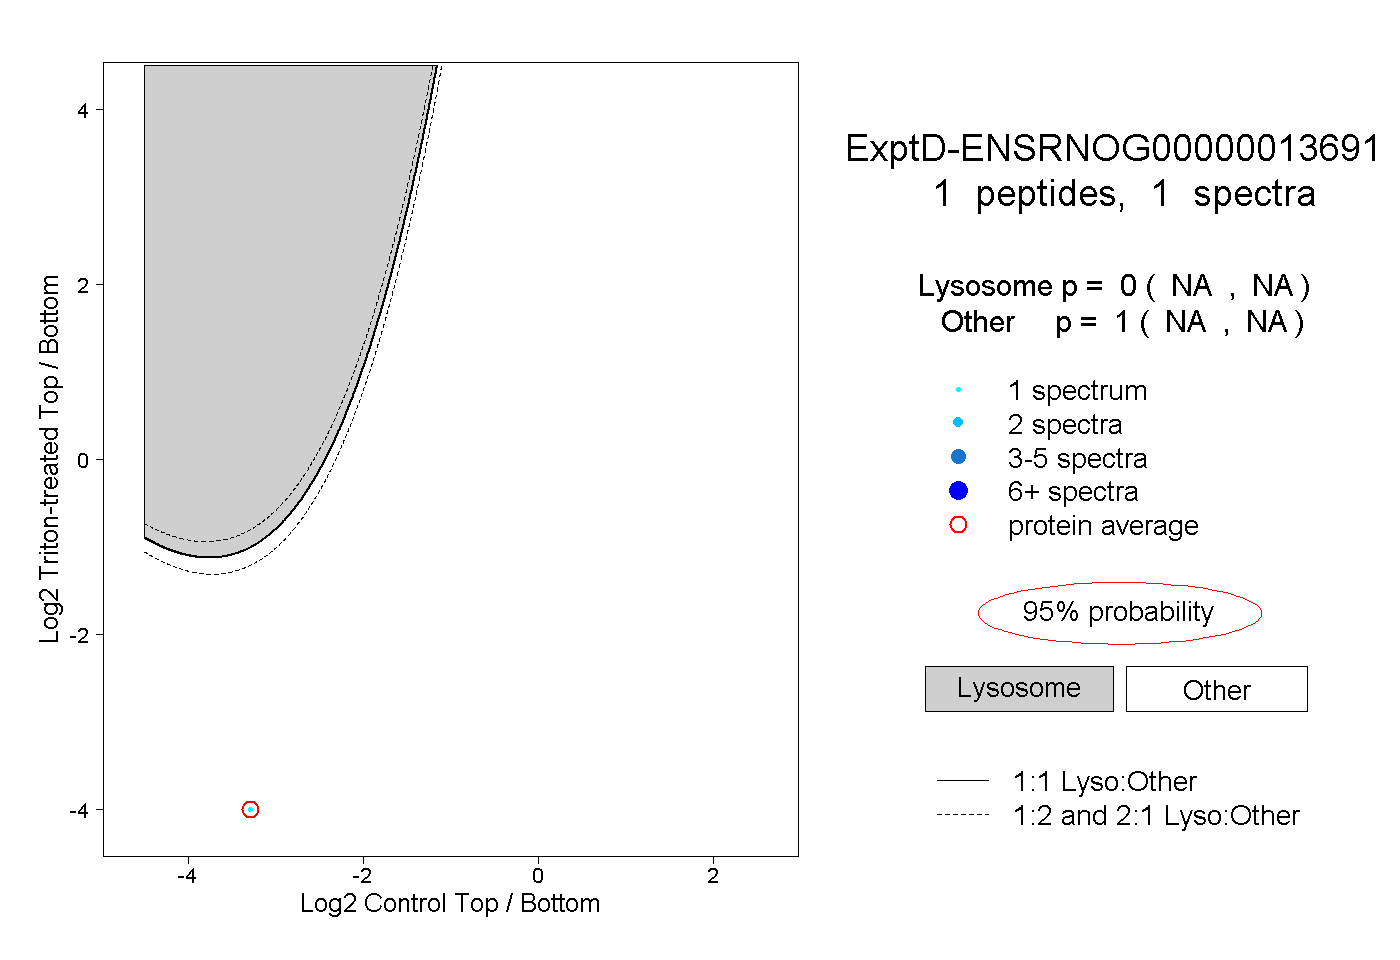
NA | NA
NA | NA