 11
11peptides
spectra
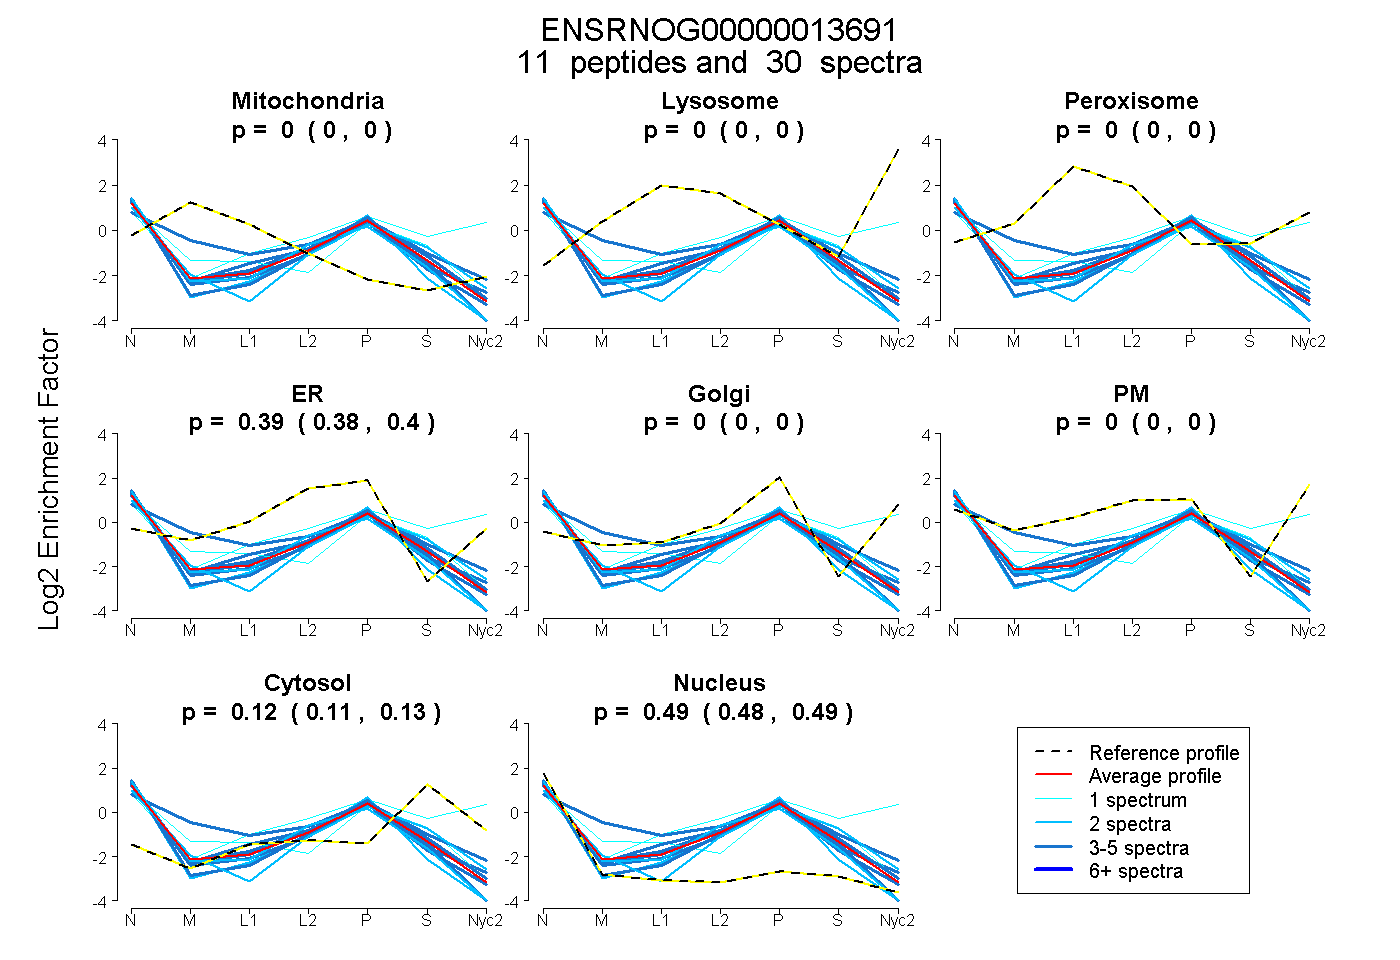
0.000 | 0.000
0.000 | 0.000
0.000 | 0.000
0.383 | 0.396
0.000 | 0.000
0.000 | 0.000
0.113 | 0.131
0.479 | 0.494
| Plot | Mito | Lyso | Perox | ER | Golgi | PM | Cytosol | Nucleus | |||||
| Expt A |
11 peptides |
30 spectra |
|
0.000 0.000 | 0.000 |
0.000 0.000 | 0.000 |
0.000 0.000 | 0.000 |
0.390 0.383 | 0.396 |
0.000 0.000 | 0.000 |
0.000 0.000 | 0.000 |
0.123 0.113 | 0.131 |
0.487 0.479 | 0.494 |
| 2 spectra, TIIFVETK | 0.000 | 0.000 | 0.000 | 0.180 | 0.121 | 0.000 | 0.251 | 0.449 | ||
| 3 spectra, LTPYEVDELR | 0.000 | 0.000 | 0.000 | 0.352 | 0.000 | 0.000 | 0.165 | 0.483 | ||
| 2 spectra, DMVGIAQTGSGK | 0.000 | 0.000 | 0.000 | 0.374 | 0.000 | 0.000 | 0.000 | 0.626 | ||
| 2 spectra, WDLSELPK | 0.000 | 0.000 | 0.000 | 0.384 | 0.000 | 0.000 | 0.024 | 0.593 | ||
| 3 spectra, QLAEDFLR | 0.000 | 0.000 | 0.000 | 0.394 | 0.000 | 0.000 | 0.064 | 0.541 | ||
| 1 spectrum, GGGFGDR | 0.028 | 0.000 | 0.000 | 0.295 | 0.000 | 0.000 | 0.256 | 0.421 | ||
| 4 spectra, CTYLVLDEADR | 0.000 | 0.000 | 0.000 | 0.397 | 0.000 | 0.000 | 0.042 | 0.561 | ||
| 1 spectrum, DGWPAMCIHGDK | 0.000 | 0.000 | 0.000 | 0.000 | 0.130 | 0.401 | 0.404 | 0.064 | ||
| 4 spectra, DWVLNEFR | 0.000 | 0.000 | 0.000 | 0.432 | 0.000 | 0.000 | 0.089 | 0.480 | ||
| 5 spectra, LIDFLESGK | 0.000 | 0.000 | 0.000 | 0.356 | 0.000 | 0.000 | 0.058 | 0.585 | ||
| 3 spectra, NFYVEHPEVAR | 0.160 | 0.000 | 0.000 | 0.432 | 0.000 | 0.000 | 0.182 | 0.225 |
| Plot | Mito | Lyso or Perox | ER | Golgi | PM | Cytosol | Nucleus | ||||||
| Expt B |
3 peptides |
8 spectra |
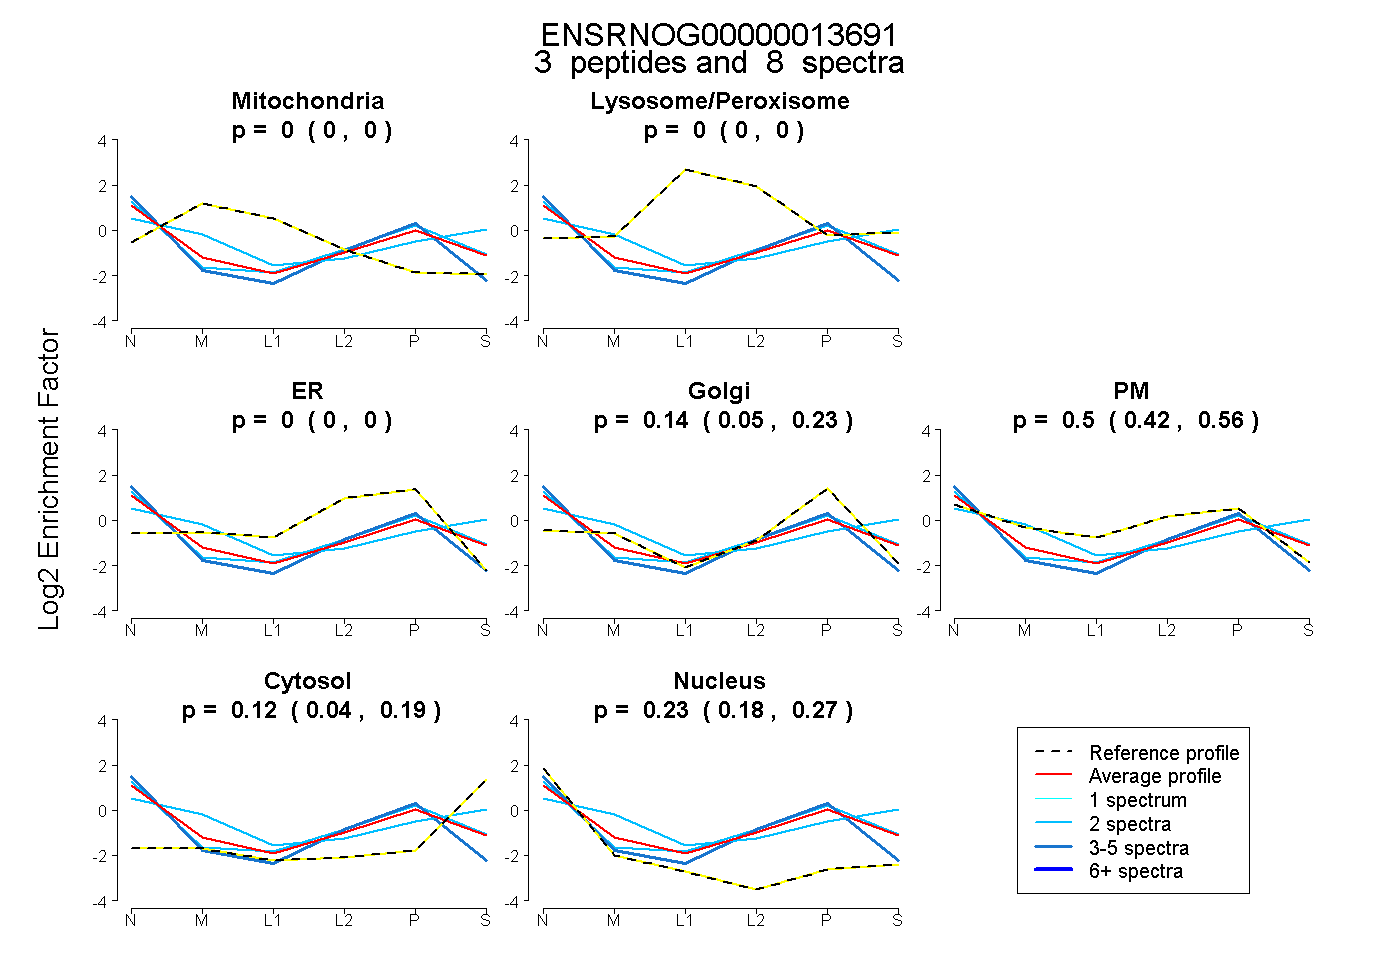 |
0.000 0.000 | 0.000 |
0.000 0.000 | 0.000 |
0.000 0.000 | 0.000 |
0.145 0.045 | 0.227 |
0.505 0.422 | 0.563 |
0.122 0.040 | 0.191 |
0.228 0.179 | 0.272 |
|||
| Plot | Lyso | Other | |||||||||||
| Expt C |
6 peptides |
13 spectra |
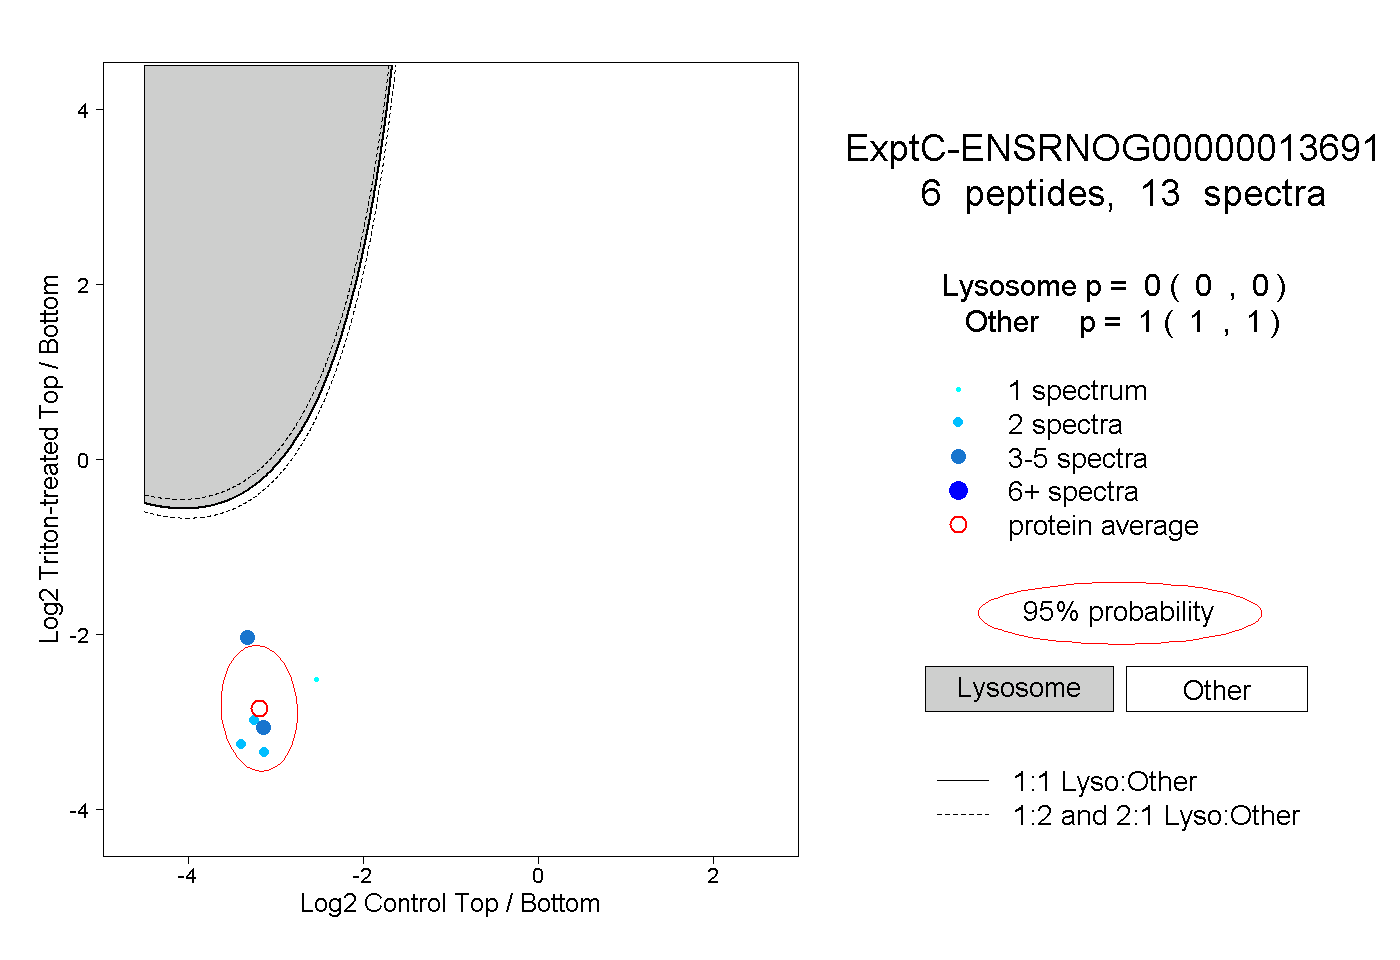 |
0.000 0.000 | 0.000 |
1.000 1.000 | 1.000 |
||||||||
| Plot | Lyso | Other | |||||||||||
| Expt D |
1 peptide |
1 spectrum |
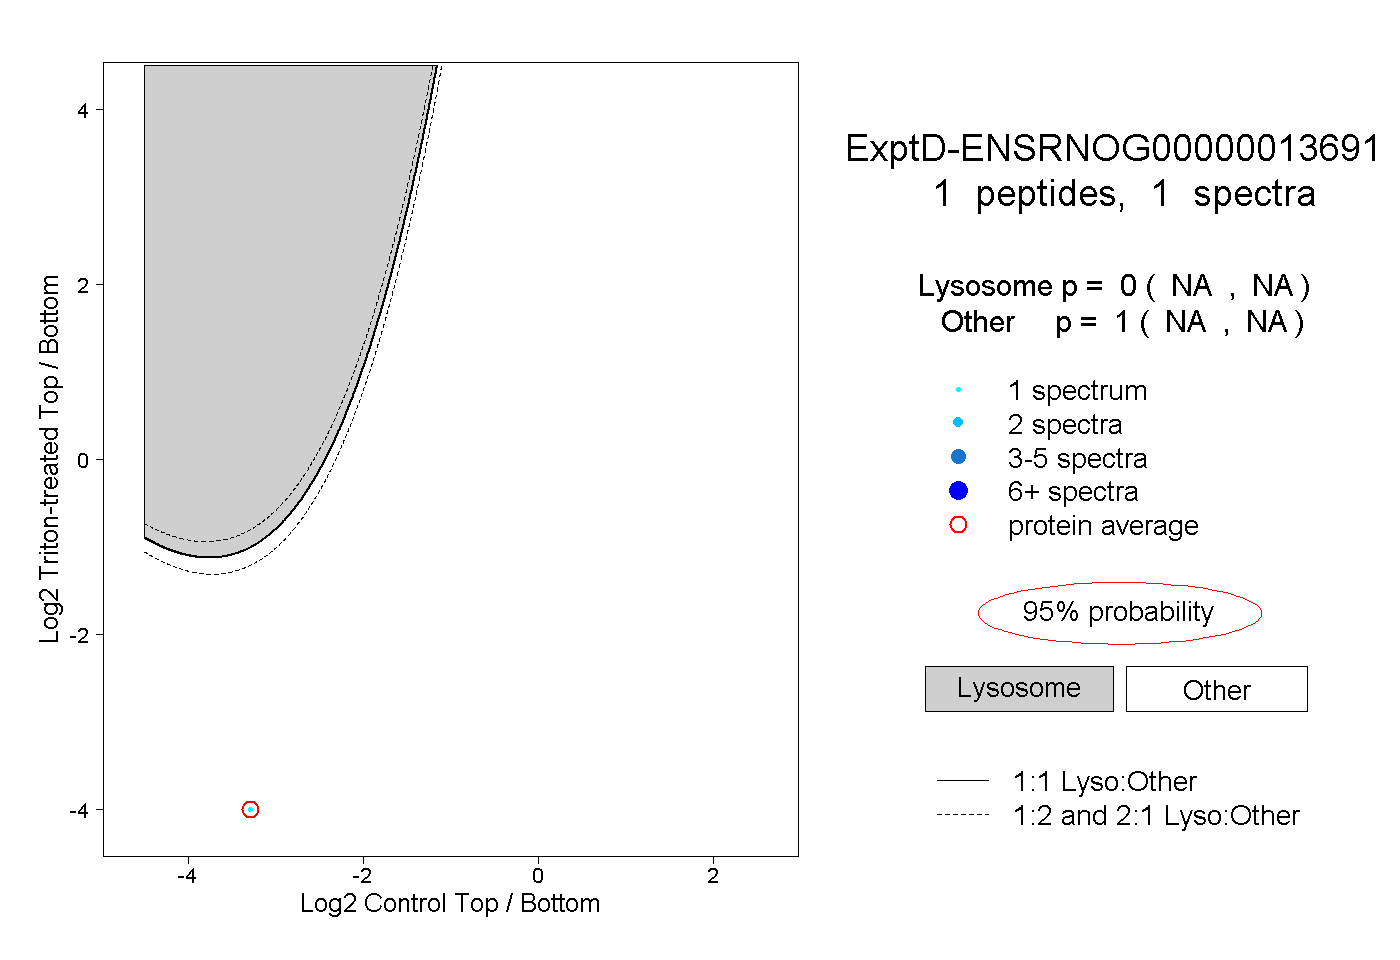 |
0.000 NA | NA |
1.000 NA | NA |