 9
9peptides
spectra
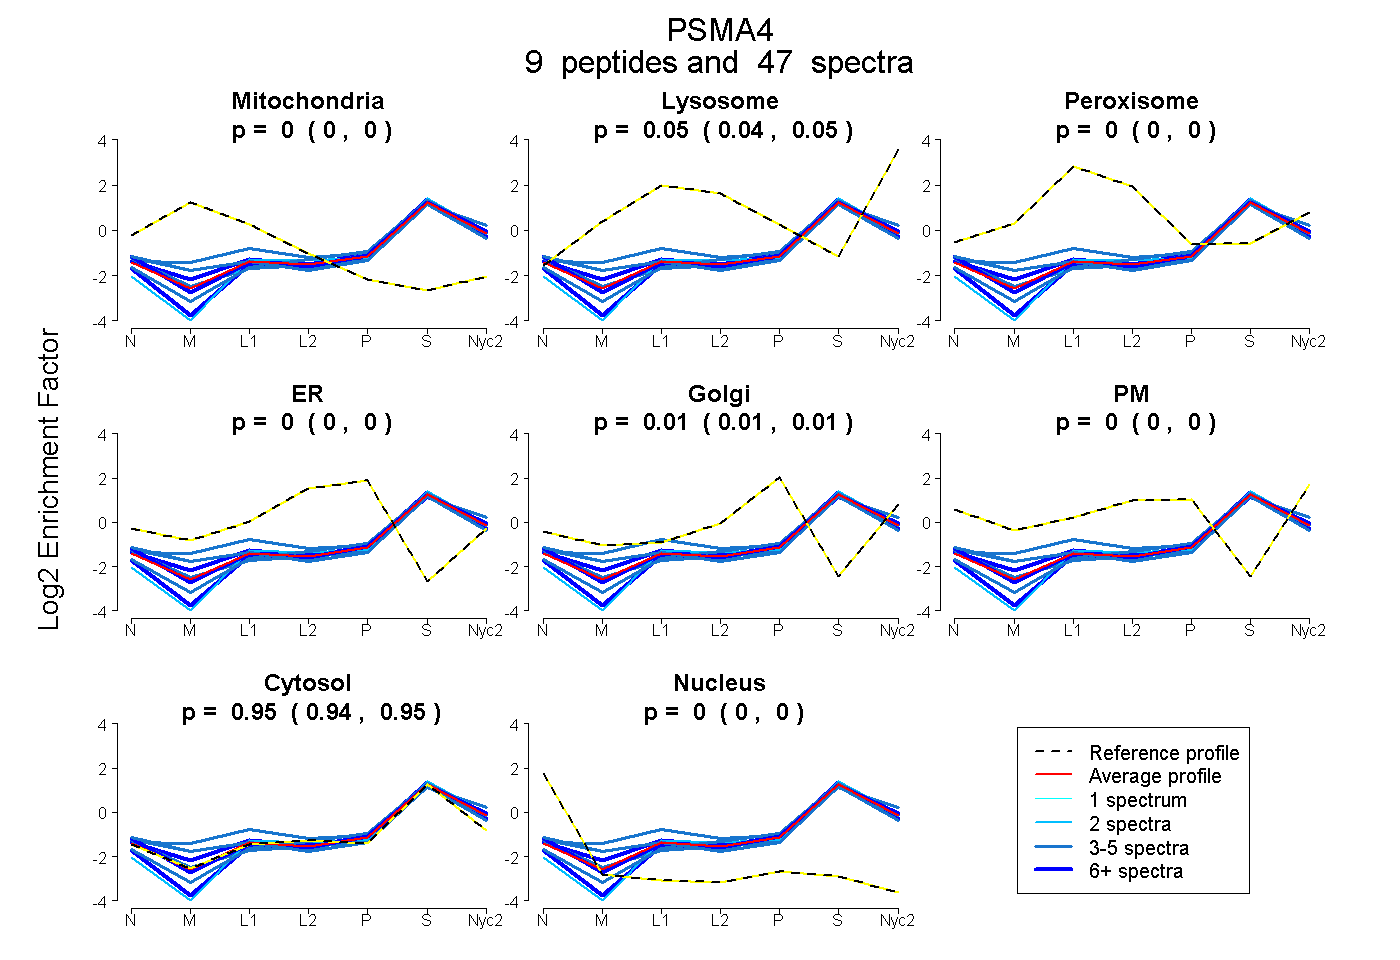
0.000 | 0.000
0.040 | 0.050
0.000 | 0.000
0.000 | 0.000
0.005 | 0.012
0.000 | 0.000
0.941 | 0.949
0.000 | 0.000
3peptides
spectra
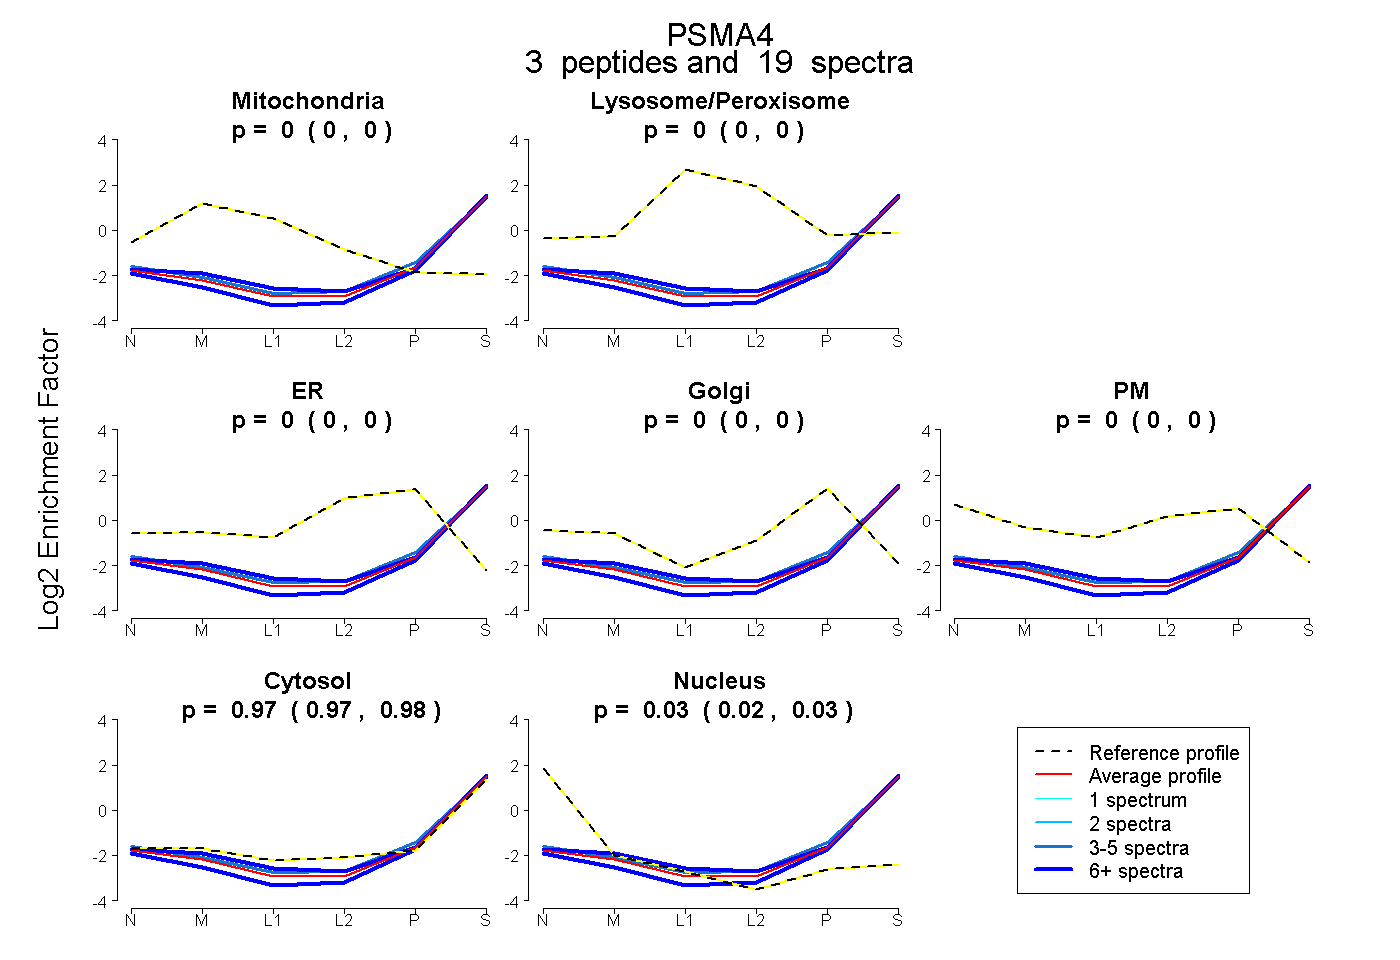
0.000 | 0.000
0.000 | 0.000
0.000 | 0.000
0.000 | 0.000
0.000 | 0.000
0.967 | 0.980
0.019 | 0.033
10peptides
spectra
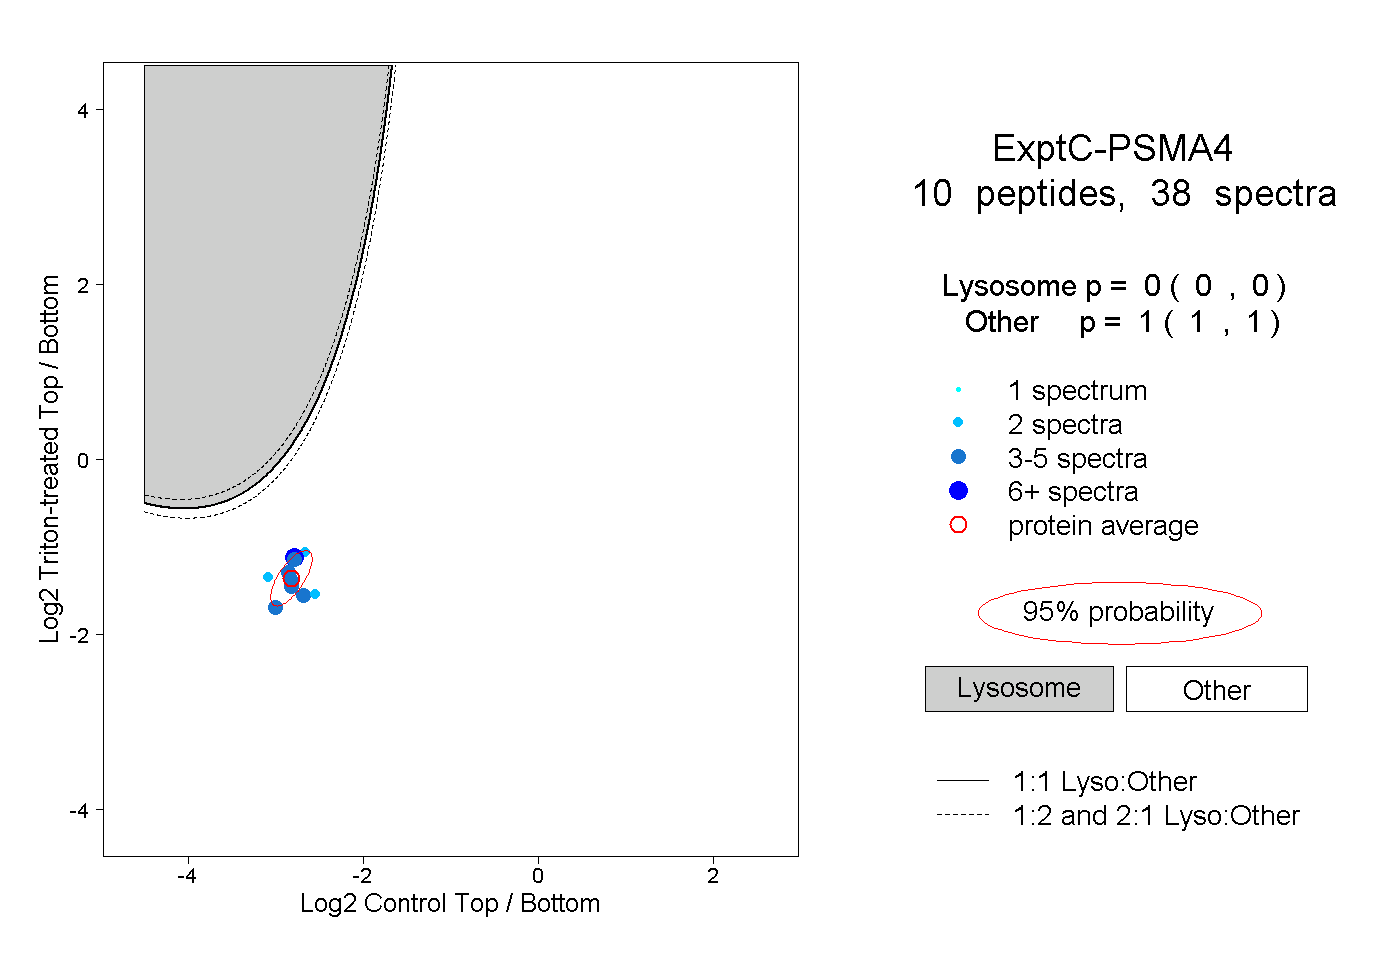
0.000 | 0.000
1.000 | 1.000
5peptides
spectra
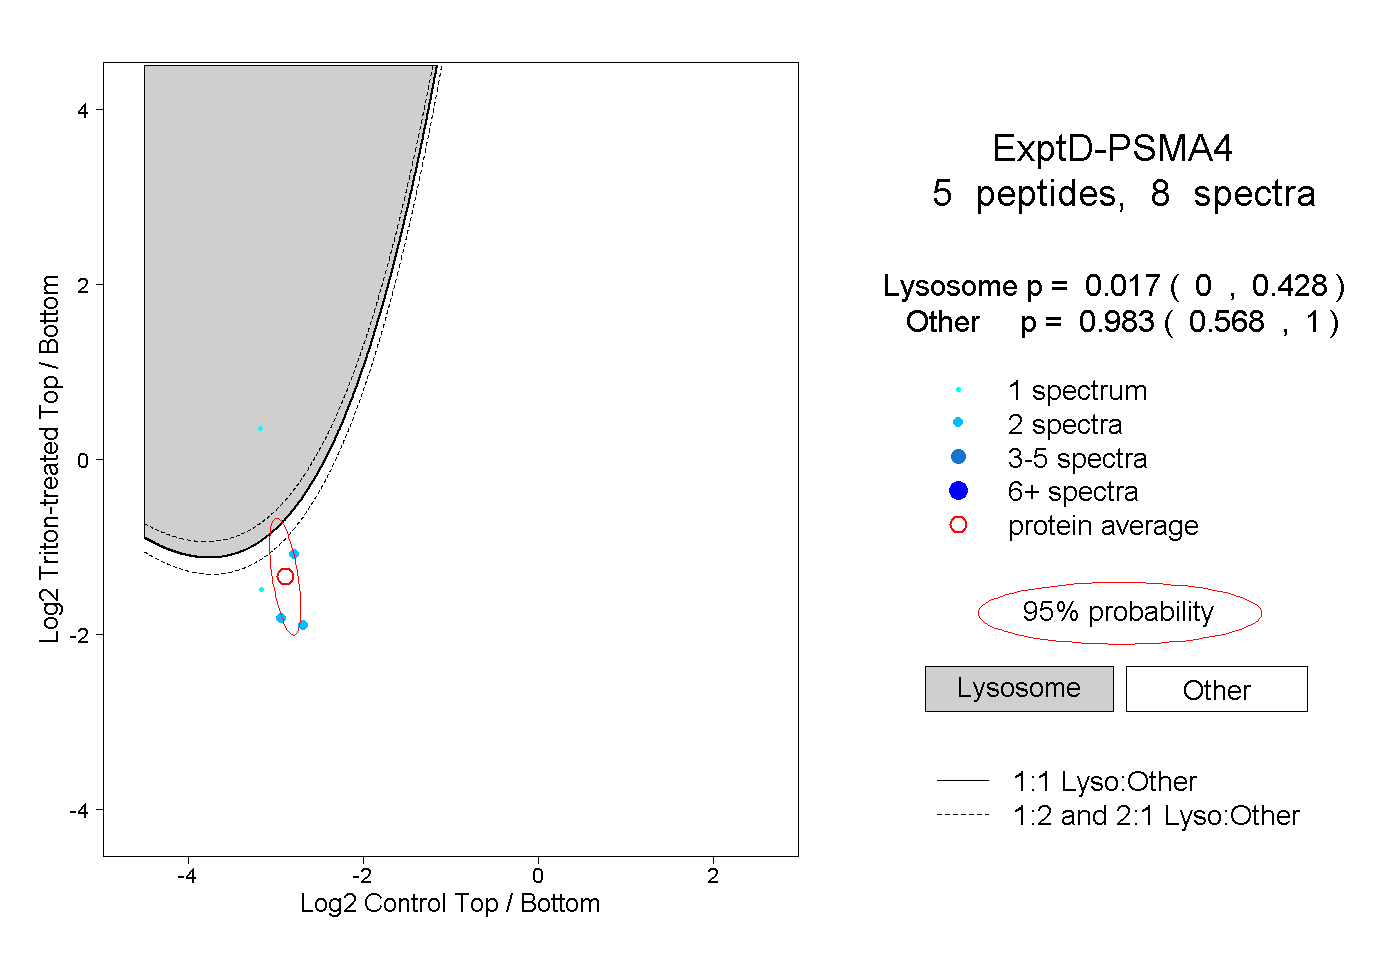
0.000 | 0.428
0.568 | 1.000