 9
9peptides
spectra
0.000 | 0.000
0.040 | 0.050
0.000 | 0.000
0.000 | 0.000
0.005 | 0.012
0.000 | 0.000
0.941 | 0.949
0.000 | 0.000
| Plot | Mito | Lyso | Perox | ER | Golgi | PM | Cytosol | Nucleus | |||||
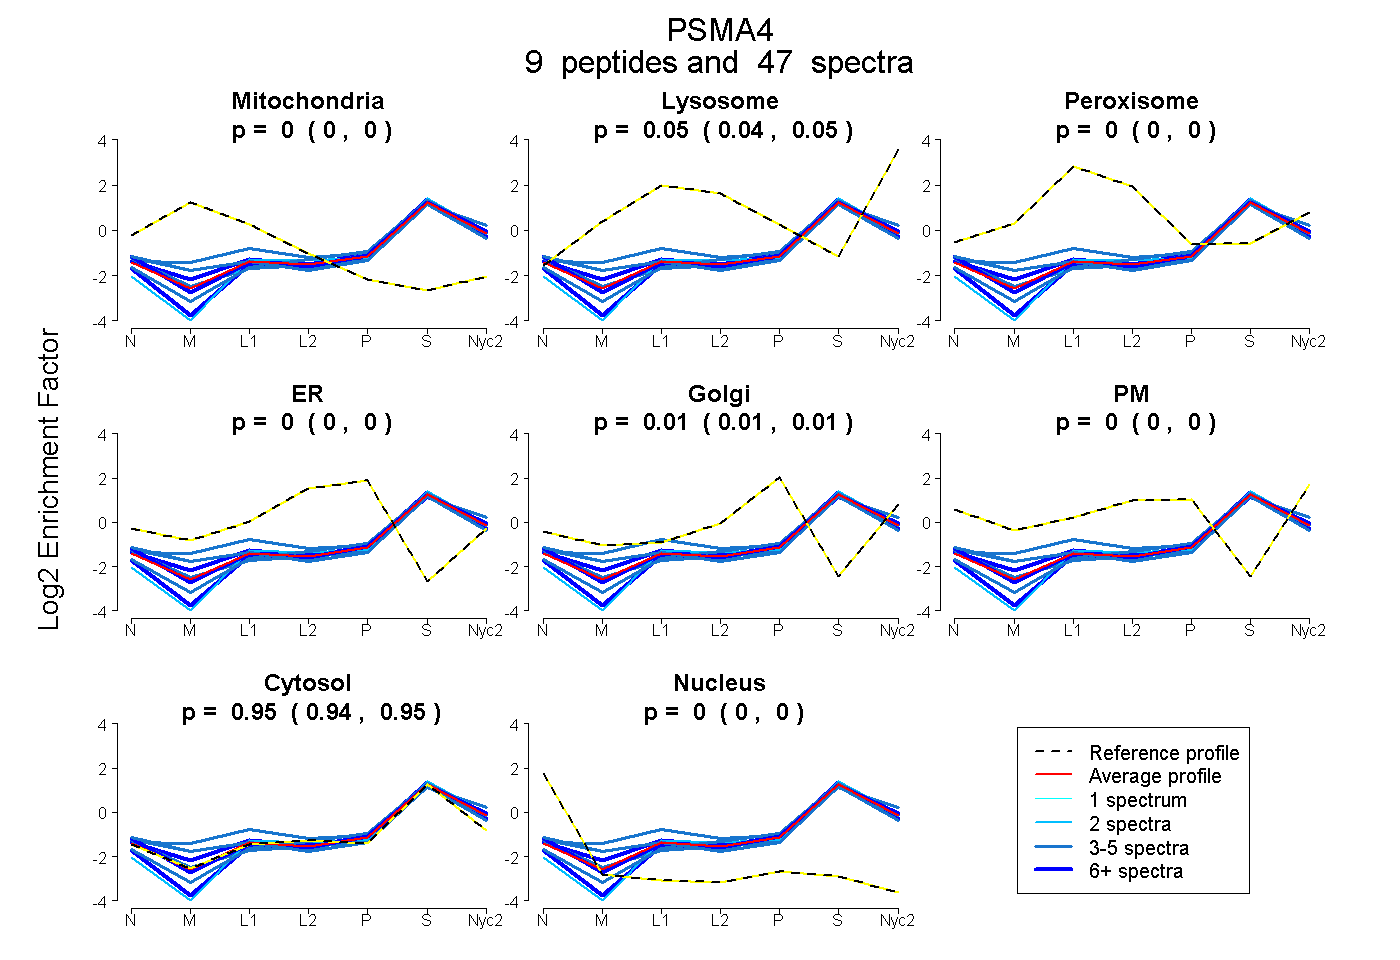
| Expt A |
9 peptides |
47 spectra |
|
0.000 0.000 | 0.000 |
0.046 0.040 | 0.050 |
0.000 0.000 | 0.000 |
0.000 0.000 | 0.000 |
0.009 0.005 | 0.012 |
0.000 0.000 | 0.000 |
0.945 0.941 | 0.949 |
0.000 0.000 | 0.000 |
| 4 spectra, EVEQLIK | 0.000 | 0.004 | 0.000 | 0.000 | 0.021 | 0.000 | 0.975 | 0.000 | ||
| 3 spectra, TMDVSK | 0.008 | 0.064 | 0.000 | 0.000 | 0.045 | 0.000 | 0.883 | 0.000 | ||
| 3 spectra, SALALAVK | 0.000 | 0.010 | 0.000 | 0.000 | 0.029 | 0.000 | 0.960 | 0.000 | ||
| 5 spectra, VEIATLTR | 0.065 | 0.036 | 0.000 | 0.000 | 0.000 | 0.000 | 0.899 | 0.000 | ||
| 3 spectra, ATCIGNNSAAAVSMLK | 0.011 | 0.196 | 0.000 | 0.000 | 0.000 | 0.000 | 0.793 | 0.000 | ||
| 8 spectra, TTIFSPEGR | 0.000 | 0.026 | 0.000 | 0.000 | 0.037 | 0.000 | 0.937 | 0.000 | ||
| 11 spectra, EGEMTLK | 0.000 | 0.085 | 0.000 | 0.000 | 0.000 | 0.000 | 0.914 | 0.000 | ||
| 8 spectra, LLDEVFFSEK | 0.000 | 0.000 | 0.000 | 0.000 | 0.000 | 0.000 | 1.000 | 0.000 | ||
| 2 spectra, QAYTQFGGK | 0.000 | 0.000 | 0.000 | 0.000 | 0.000 | 0.000 | 1.000 | 0.000 |
| Plot | Mito | Lyso or Perox | ER | Golgi | PM | Cytosol | Nucleus | ||||||
| Expt B |
3 peptides |
19 spectra |
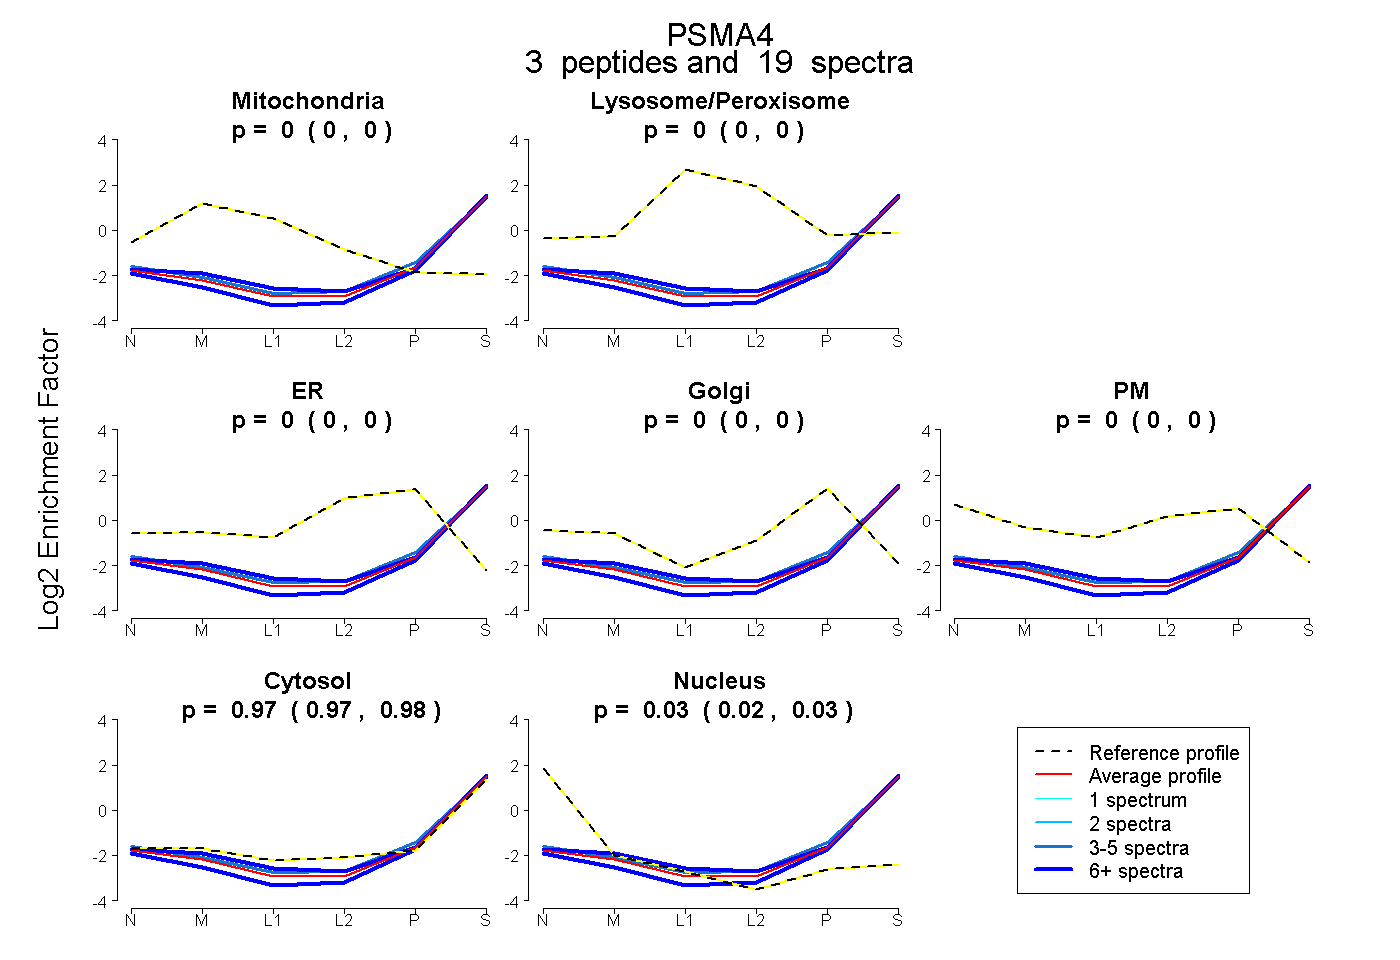 |
0.000 0.000 | 0.000 |
0.000 0.000 | 0.000 |
0.000 0.000 | 0.000 |
0.000 0.000 | 0.000 |
0.000 0.000 | 0.000 |
0.973 0.967 | 0.980 |
0.027 0.019 | 0.033 |
|||
| Plot | Lyso | Other | |||||||||||
| Expt C |
10 peptides |
38 spectra |
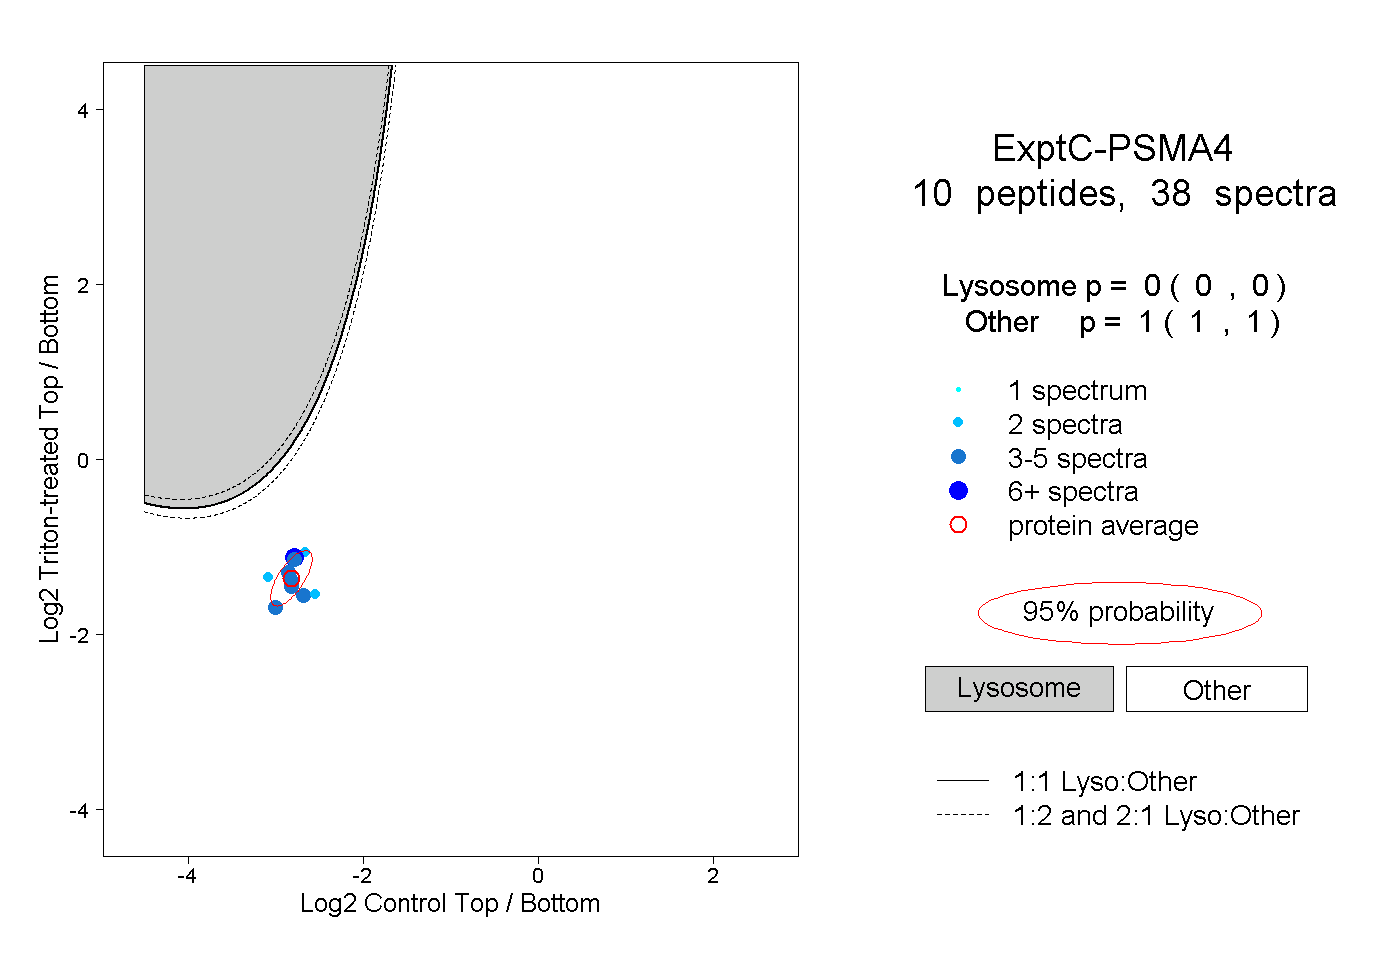 |
0.000 0.000 | 0.000 |
1.000 1.000 | 1.000 |
||||||||
| Plot | Lyso | Other | |||||||||||
| Expt D |
5 peptides |
8 spectra |
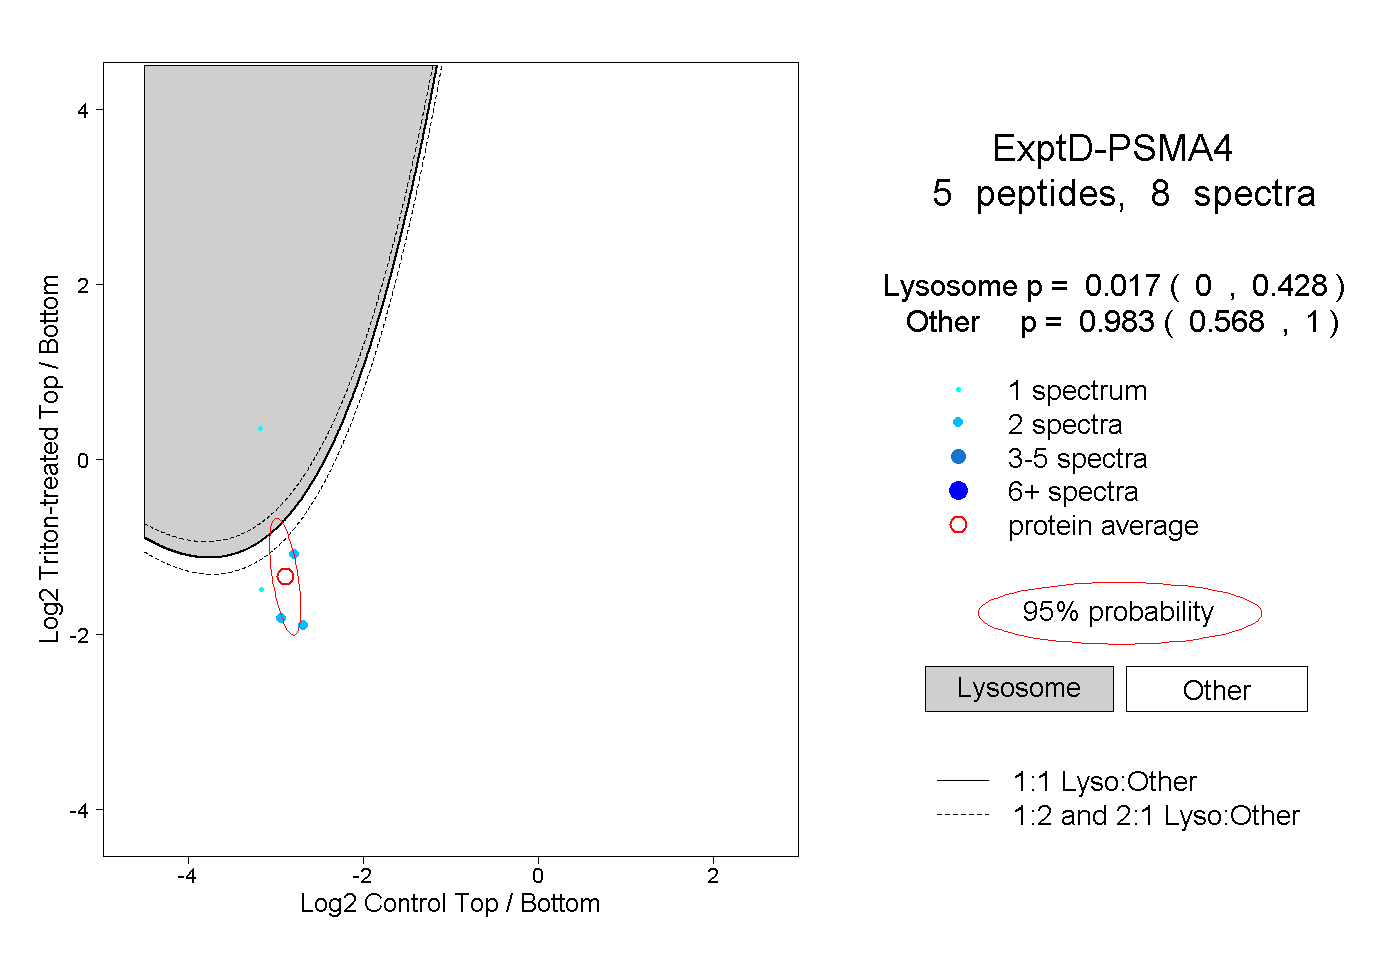 |
0.017 0.000 | 0.428 |
0.983 0.568 | 1.000 |