 12
12peptides
spectra
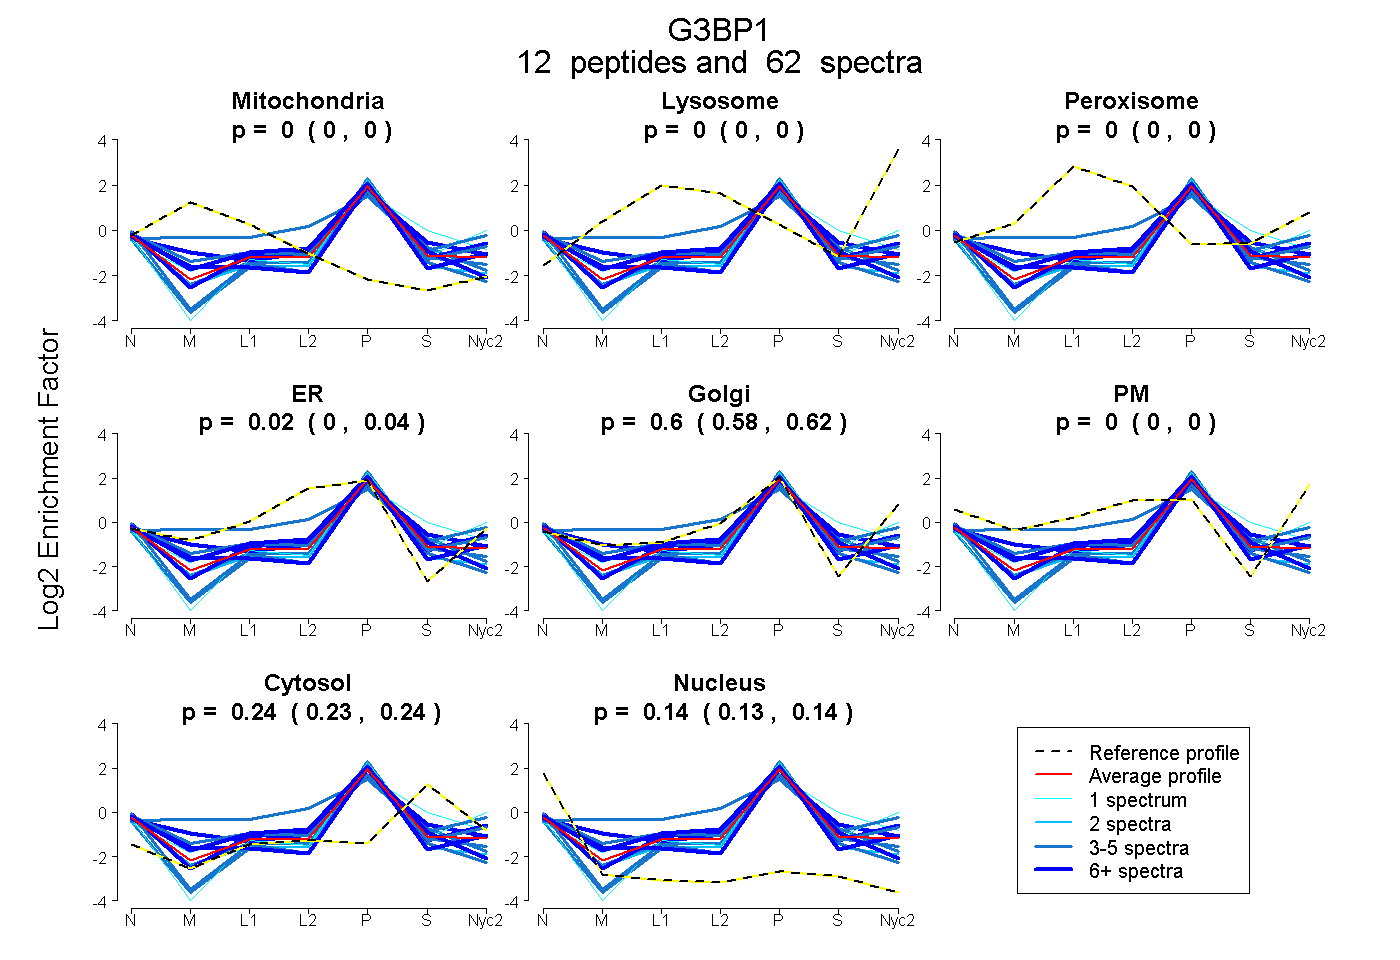
0.000 | 0.000
0.000 | 0.000
0.000 | 0.000
0.002 | 0.039
0.579 | 0.620
0.000 | 0.000
0.231 | 0.243
0.133 | 0.143
5peptides
spectra
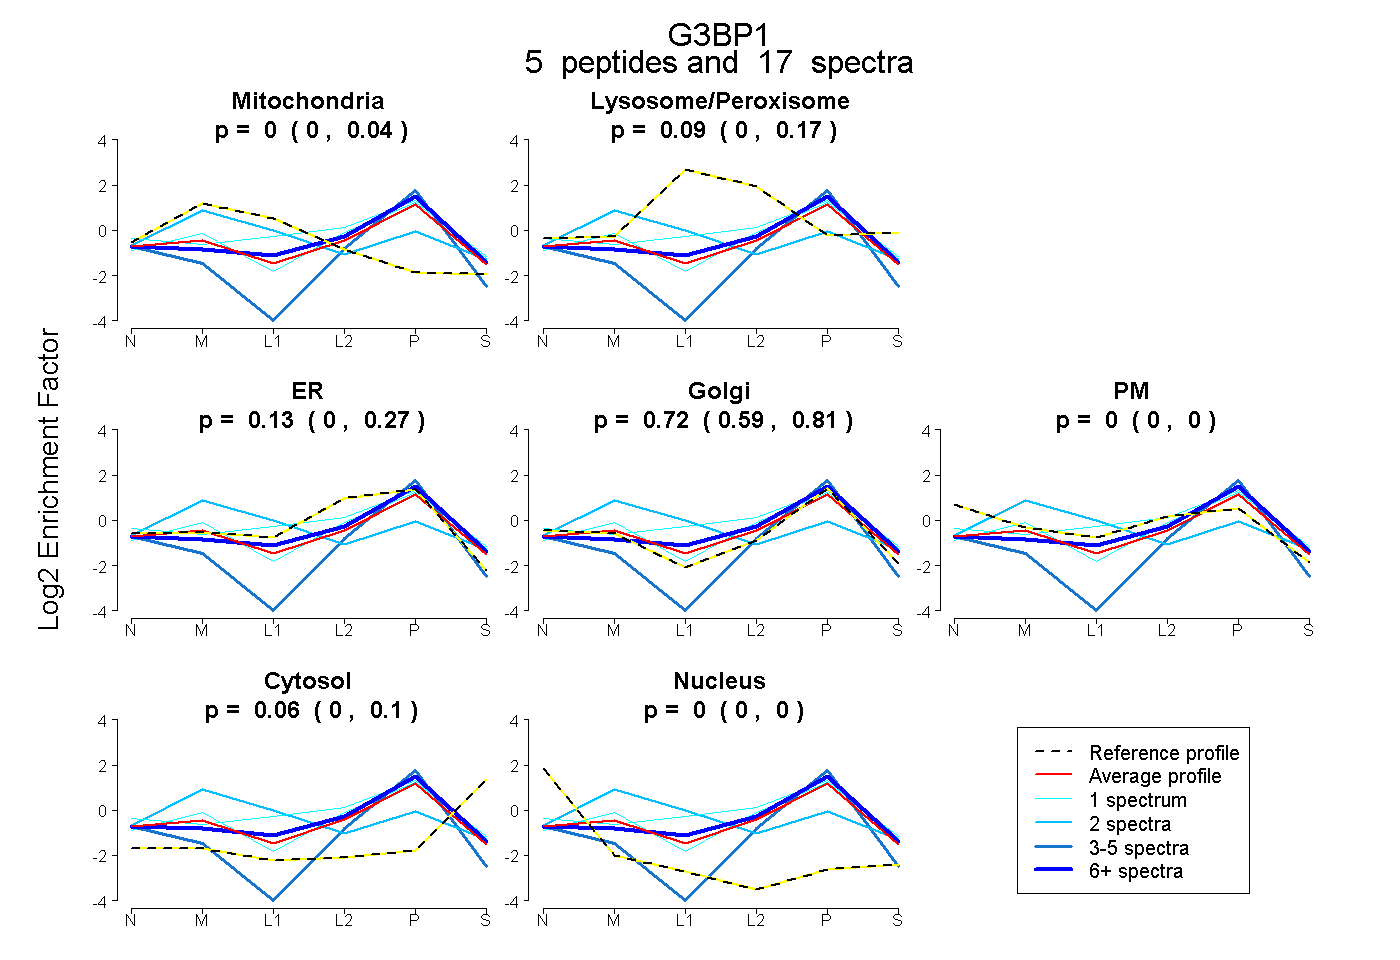
0.000 | 0.042
0.000 | 0.167
0.000 | 0.270
0.589 | 0.809
0.000 | 0.000
0.004 | 0.104
0.000 | 0.000
3peptides
spectra
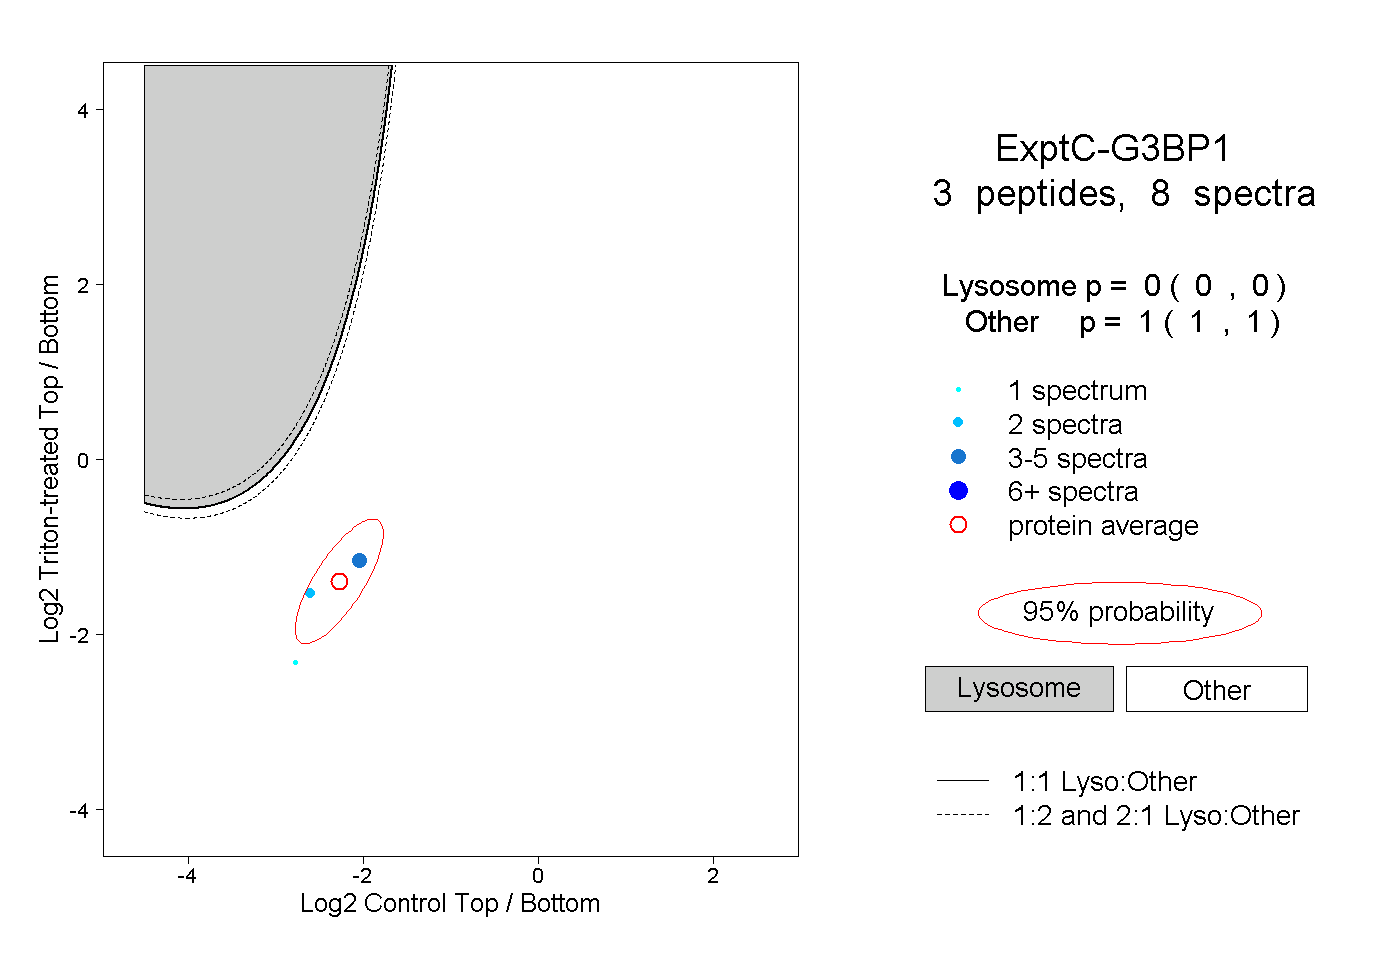
0.000 | 0.000
1.000 | 1.000
3peptides
spectra
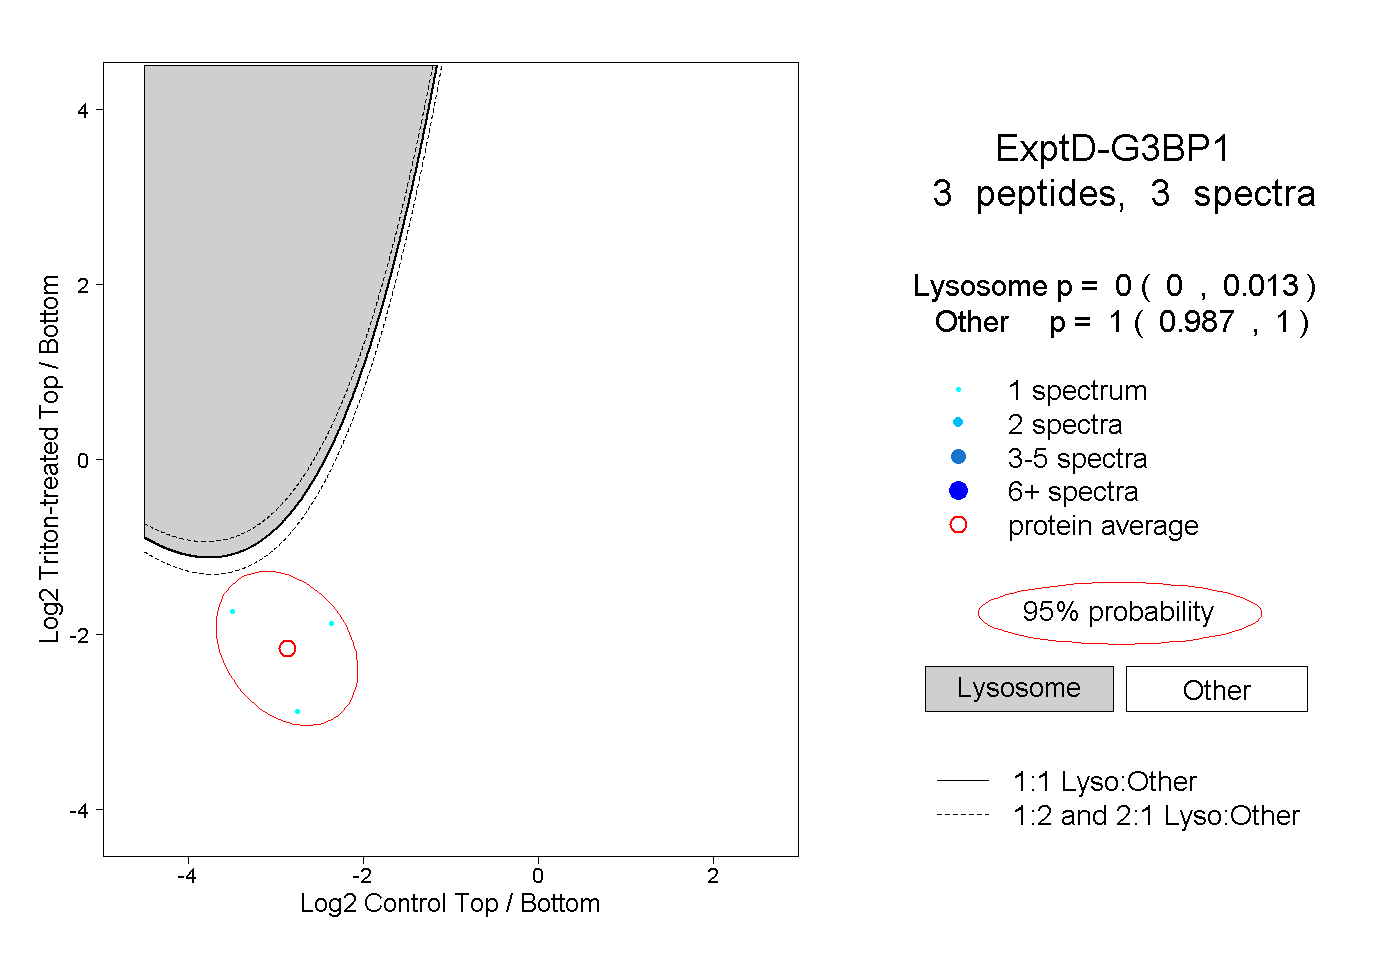
0.000 | 0.013
0.987 | 1.000