 12
12peptides
spectra
0.000 | 0.000
0.000 | 0.000
0.000 | 0.000
0.002 | 0.039
0.579 | 0.620
0.000 | 0.000
0.231 | 0.243
0.133 | 0.143
| Plot | Mito | Lyso | Perox | ER | Golgi | PM | Cytosol | Nucleus | |||||
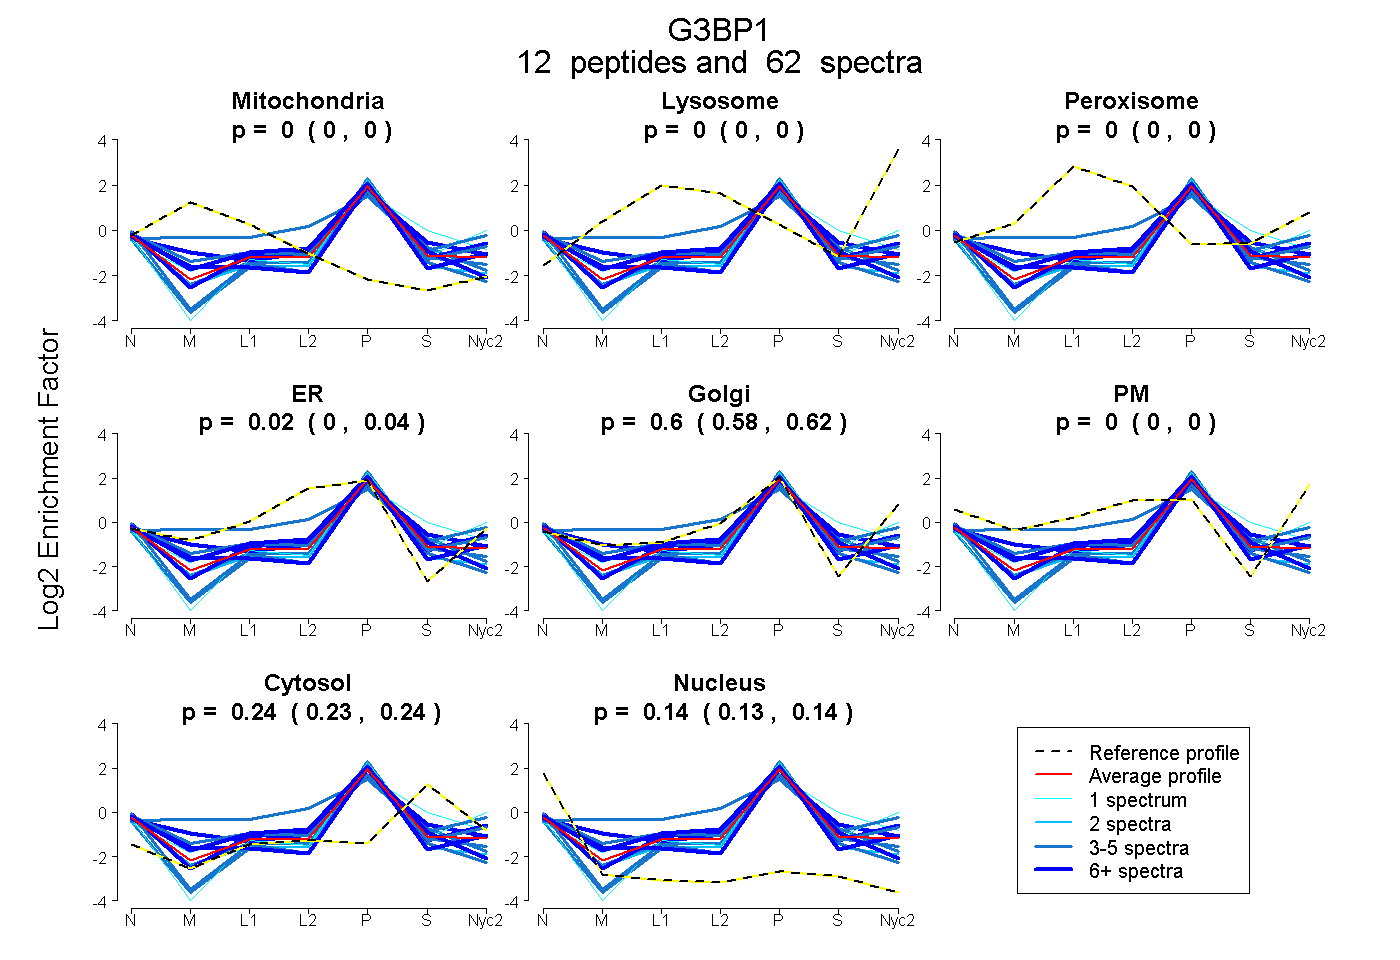
| Expt A |
12 peptides |
62 spectra |
|
0.000 0.000 | 0.000 |
0.000 0.000 | 0.000 |
0.000 0.000 | 0.000 |
0.021 0.002 | 0.039 |
0.603 0.579 | 0.620 |
0.000 0.000 | 0.000 |
0.238 0.231 | 0.243 |
0.138 0.133 | 0.143 |
| 3 spectra, TFSWASVTSK | 0.000 | 0.000 | 0.000 | 0.000 | 0.598 | 0.000 | 0.219 | 0.183 | ||
| 1 spectrum, GPGGPR | 0.000 | 0.000 | 0.000 | 0.082 | 0.450 | 0.000 | 0.467 | 0.000 | ||
| 2 spectra, EAGEPGDVEPR | 0.000 | 0.000 | 0.000 | 0.001 | 0.612 | 0.000 | 0.114 | 0.273 | ||
| 15 spectra, VLNNRPIMFR | 0.000 | 0.000 | 0.000 | 0.177 | 0.569 | 0.000 | 0.118 | 0.136 | ||
| 1 spectrum, NLPPSGAVPVTGTPPHVVK | 0.000 | 0.000 | 0.000 | 0.000 | 0.636 | 0.000 | 0.287 | 0.078 | ||
| 6 spectra, VMEKPSPLLVGR | 0.000 | 0.000 | 0.000 | 0.000 | 0.539 | 0.000 | 0.232 | 0.229 | ||
| 3 spectra, DFFQSYGNVVELR | 0.000 | 0.000 | 0.000 | 0.039 | 0.494 | 0.000 | 0.299 | 0.168 | ||
| 3 spectra, LNVEEK | 0.000 | 0.000 | 0.000 | 0.245 | 0.382 | 0.000 | 0.211 | 0.162 | ||
| 13 spectra, INIPPQR | 0.000 | 0.000 | 0.000 | 0.000 | 0.693 | 0.000 | 0.213 | 0.094 | ||
| 7 spectra, FYVHNDIFR | 0.000 | 0.000 | 0.000 | 0.087 | 0.519 | 0.000 | 0.323 | 0.071 | ||
| 4 spectra, GGPSGGMR | 0.000 | 0.000 | 0.000 | 0.000 | 0.513 | 0.000 | 0.205 | 0.282 | ||
| 4 spectra, QYYTLLNQAPDMLHR | 0.040 | 0.000 | 0.123 | 0.252 | 0.397 | 0.000 | 0.188 | 0.000 |
| Plot | Mito | Lyso or Perox | ER | Golgi | PM | Cytosol | Nucleus | ||||||
| Expt B |
5 peptides |
17 spectra |
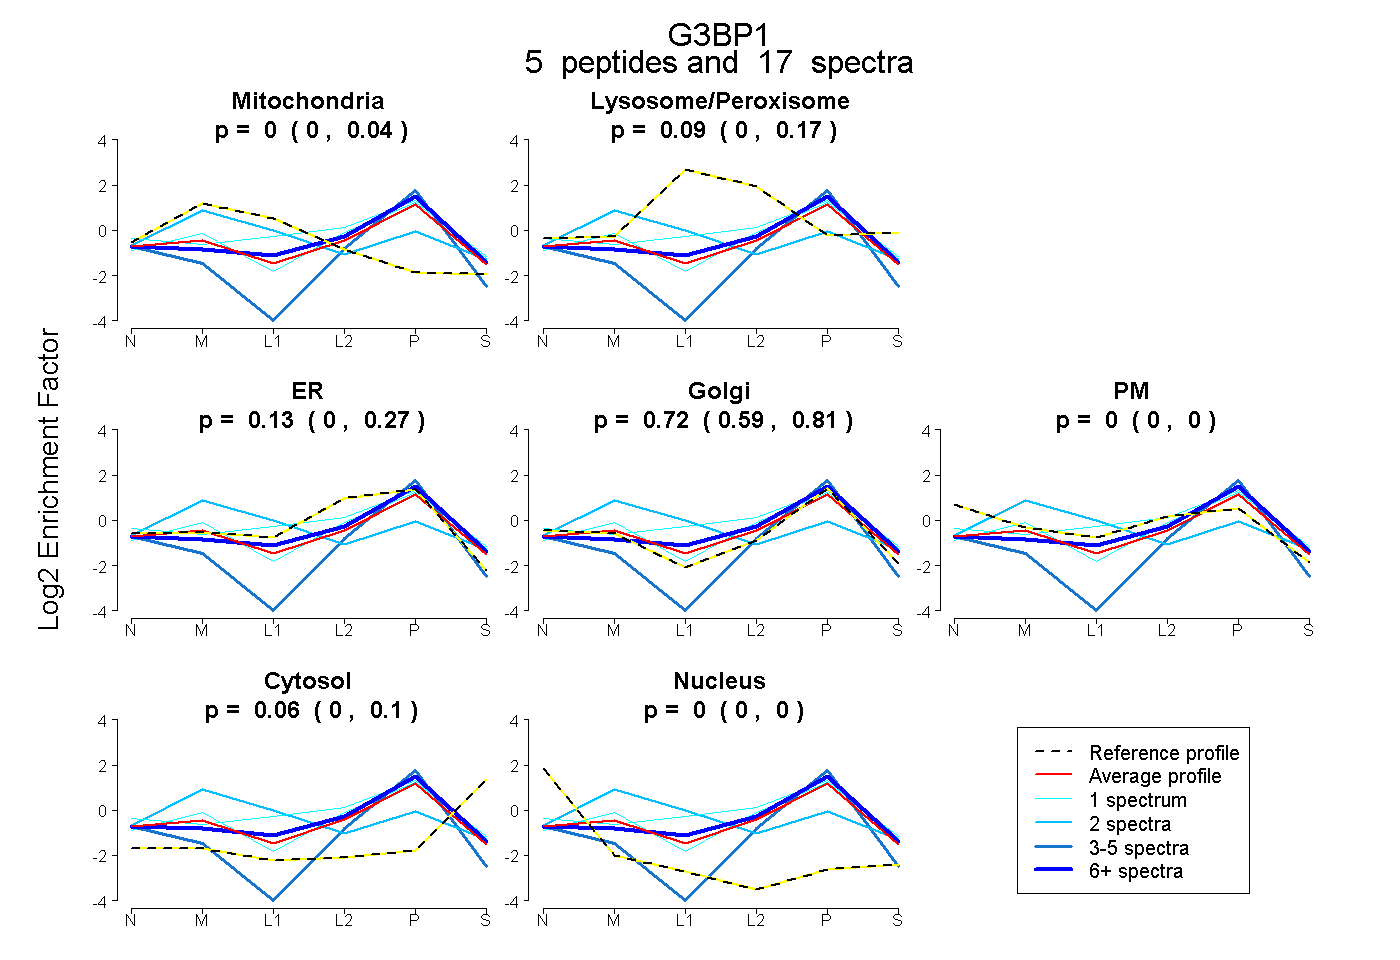 |
0.000 0.000 | 0.042 |
0.094 0.000 | 0.167 |
0.131 0.000 | 0.270 |
0.719 0.589 | 0.809 |
0.000 0.000 | 0.000 |
0.055 0.004 | 0.104 |
0.000 0.000 | 0.000 |
|||
| Plot | Lyso | Other | |||||||||||
| Expt C |
3 peptides |
8 spectra |
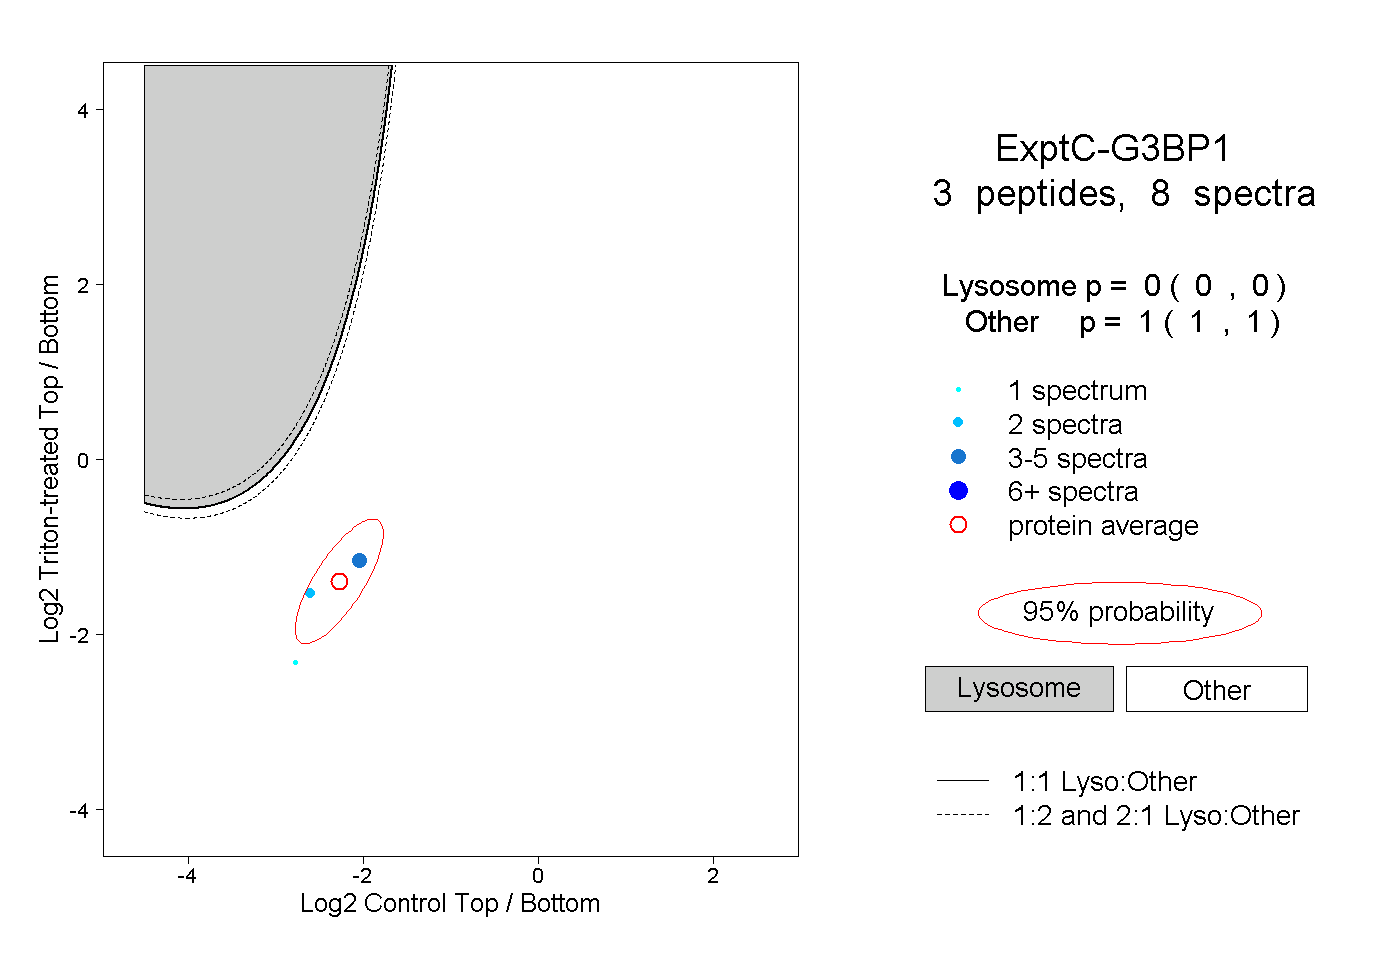 |
0.000 0.000 | 0.000 |
1.000 1.000 | 1.000 |
||||||||
| Plot | Lyso | Other | |||||||||||
| Expt D |
3 peptides |
3 spectra |
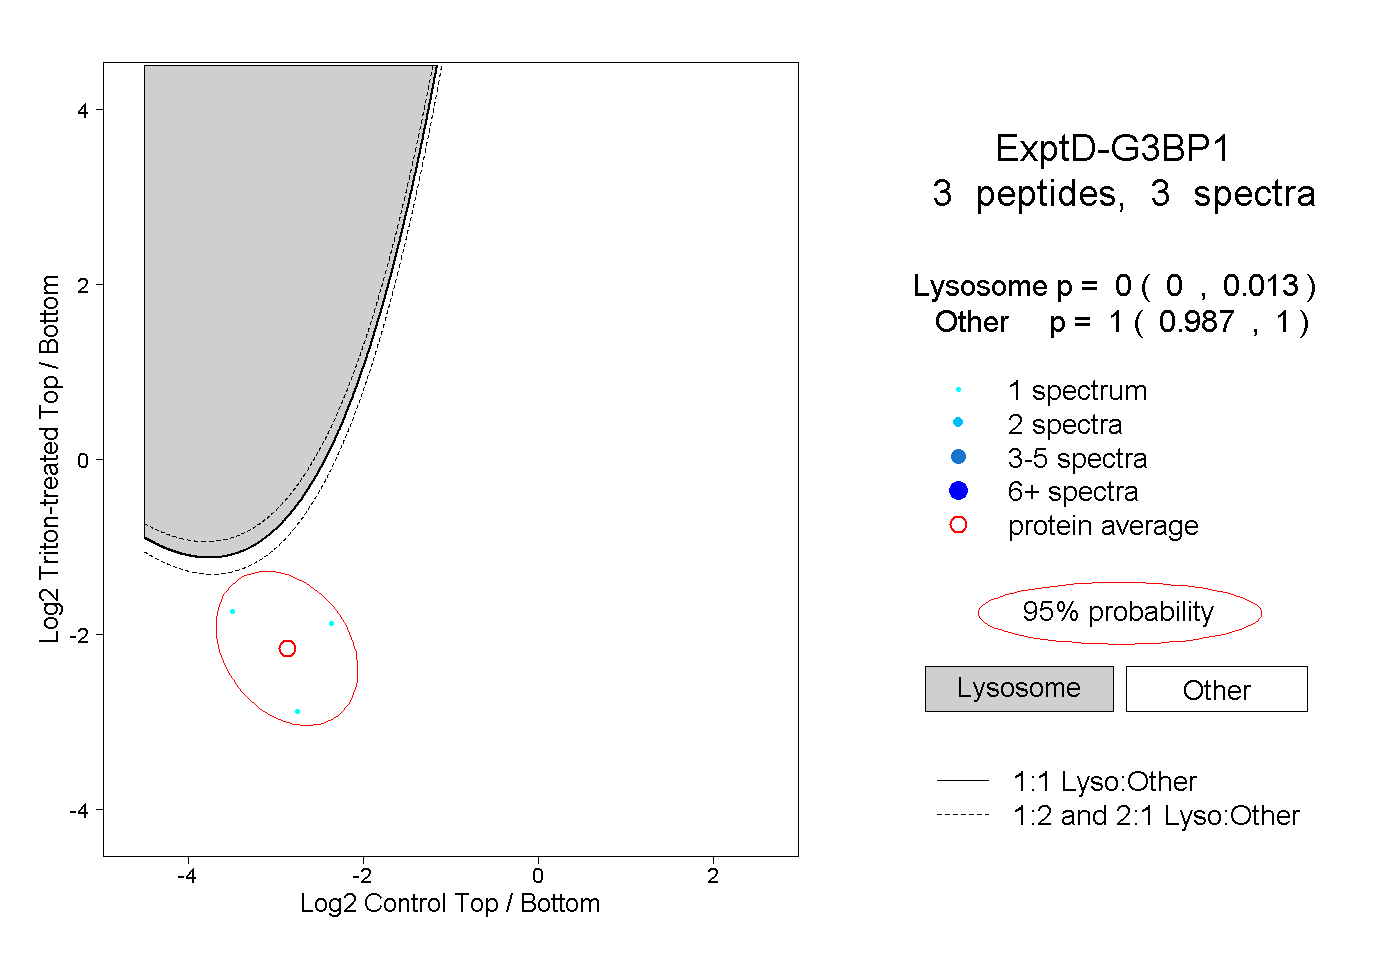 |
0.000 0.000 | 0.013 |
1.000 0.987 | 1.000 |