 4
4peptides
spectra
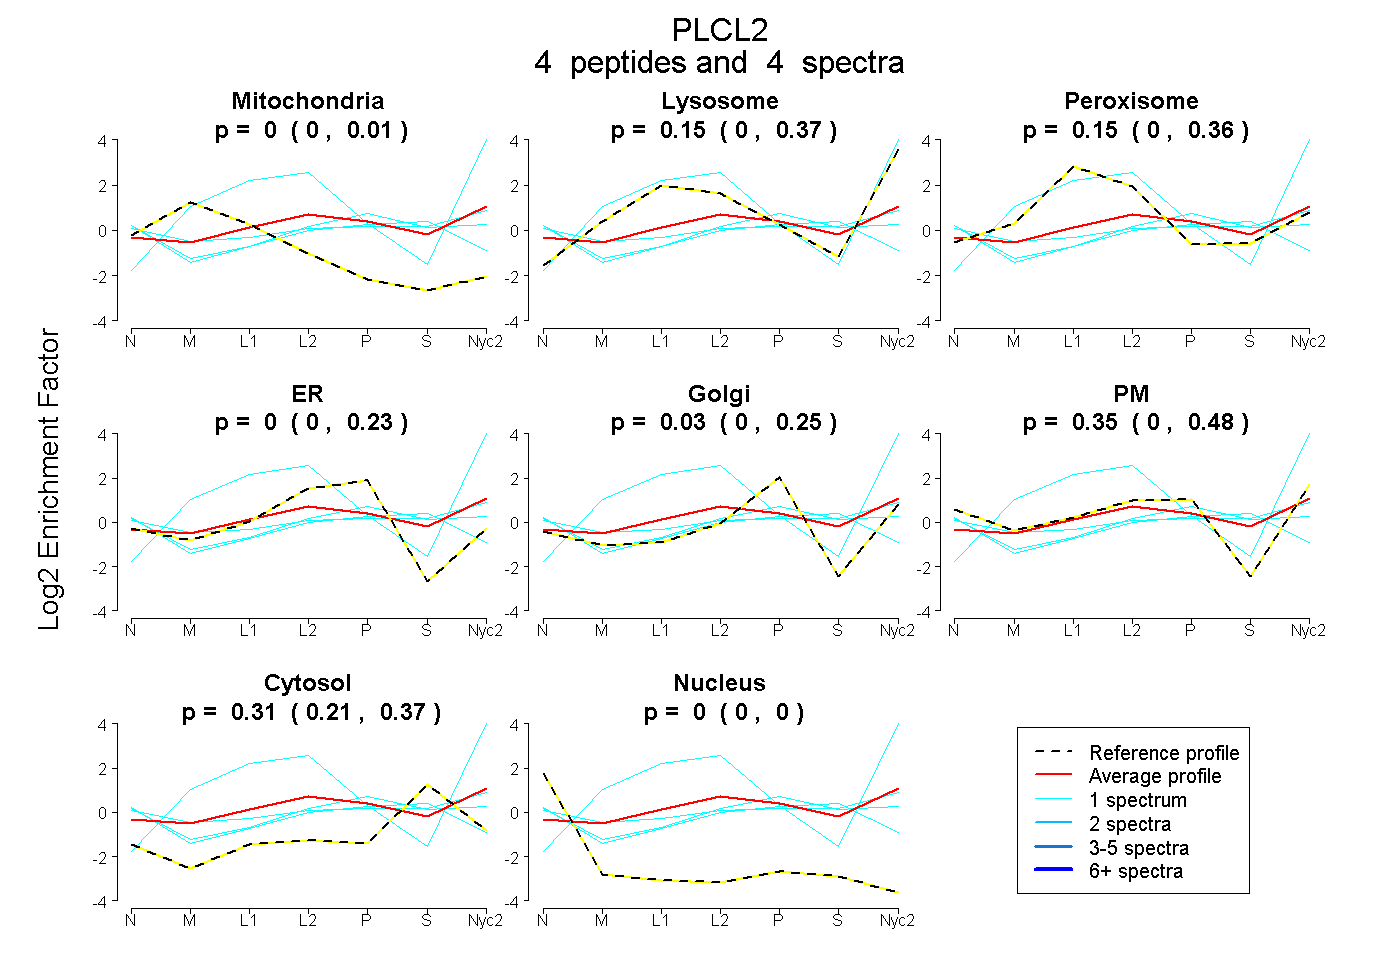
0.000 | 0.006
0.000 | 0.374
0.000 | 0.363
0.000 | 0.231
0.000 | 0.247
0.000 | 0.477
0.205 | 0.368
0.000 | 0.000
1peptide
spectrum
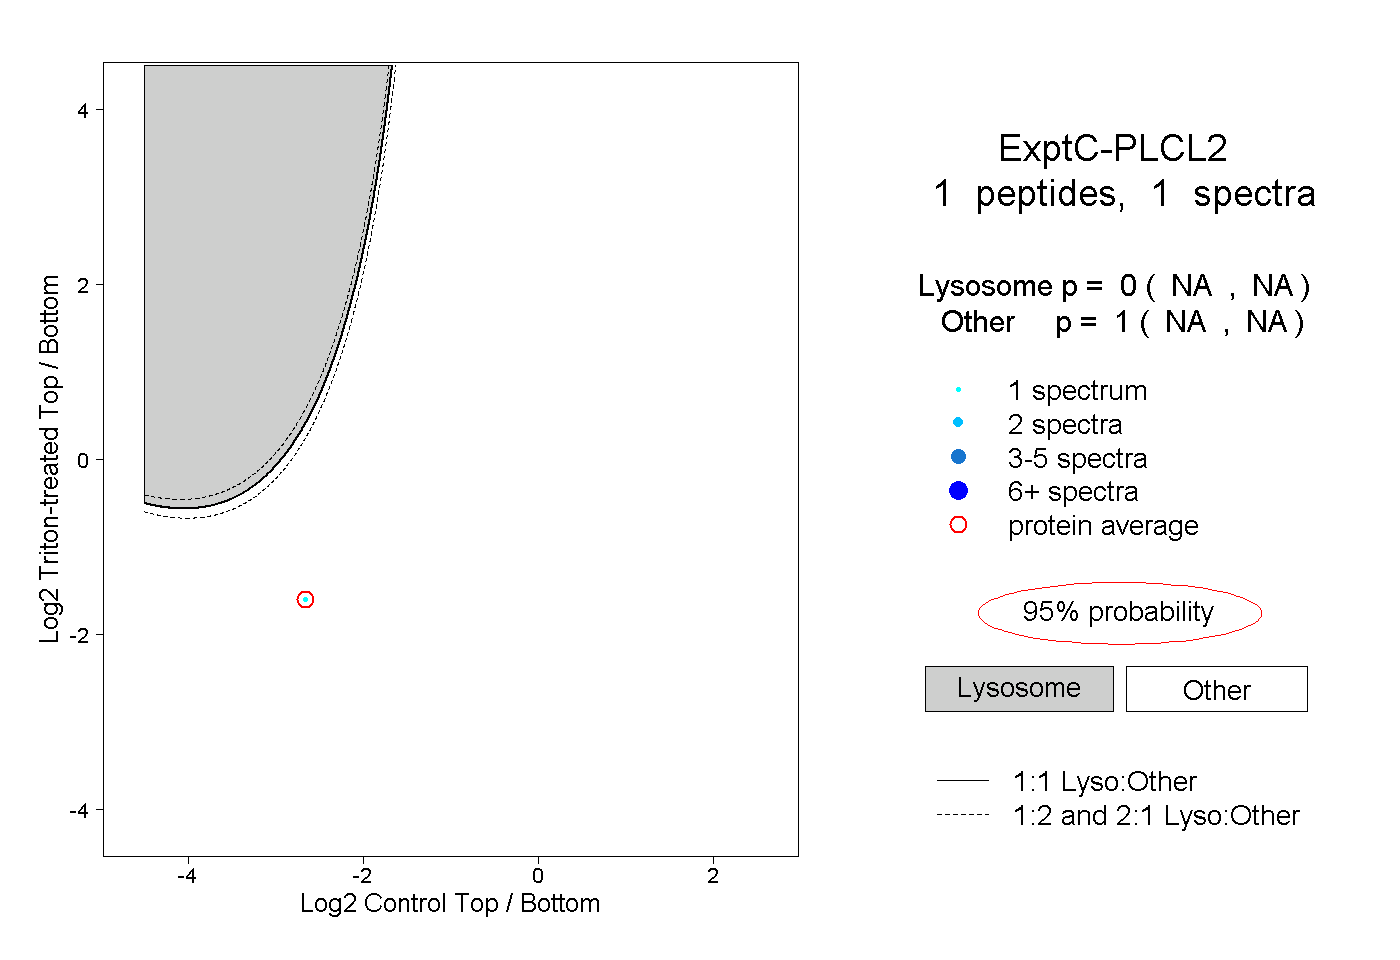
NA | NA
NA | NA
1peptide
spectrum
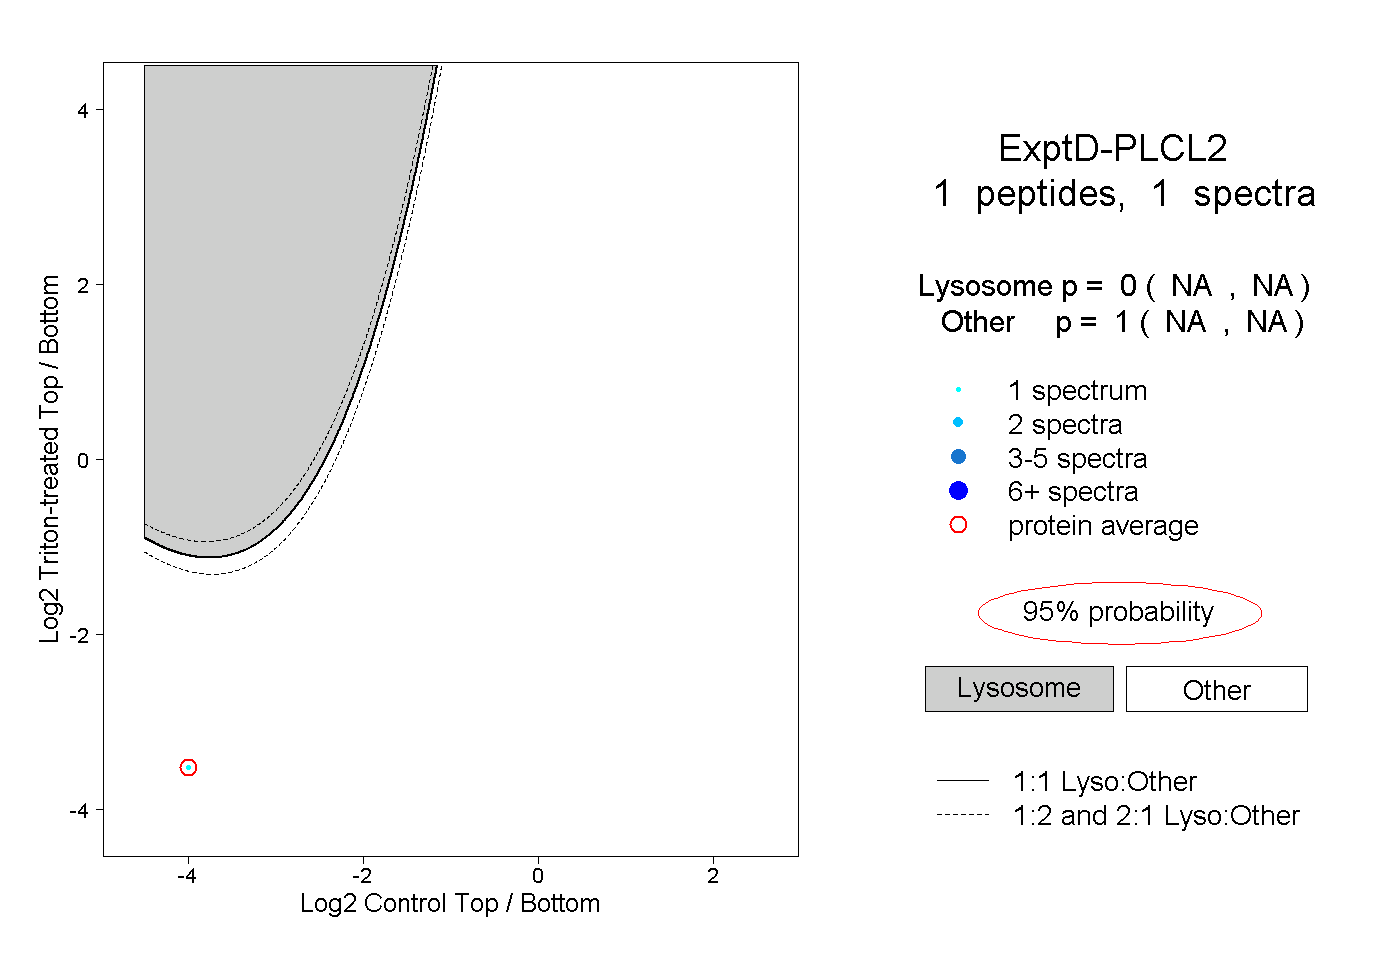
NA | NA
NA | NA