 4
4peptides
spectra
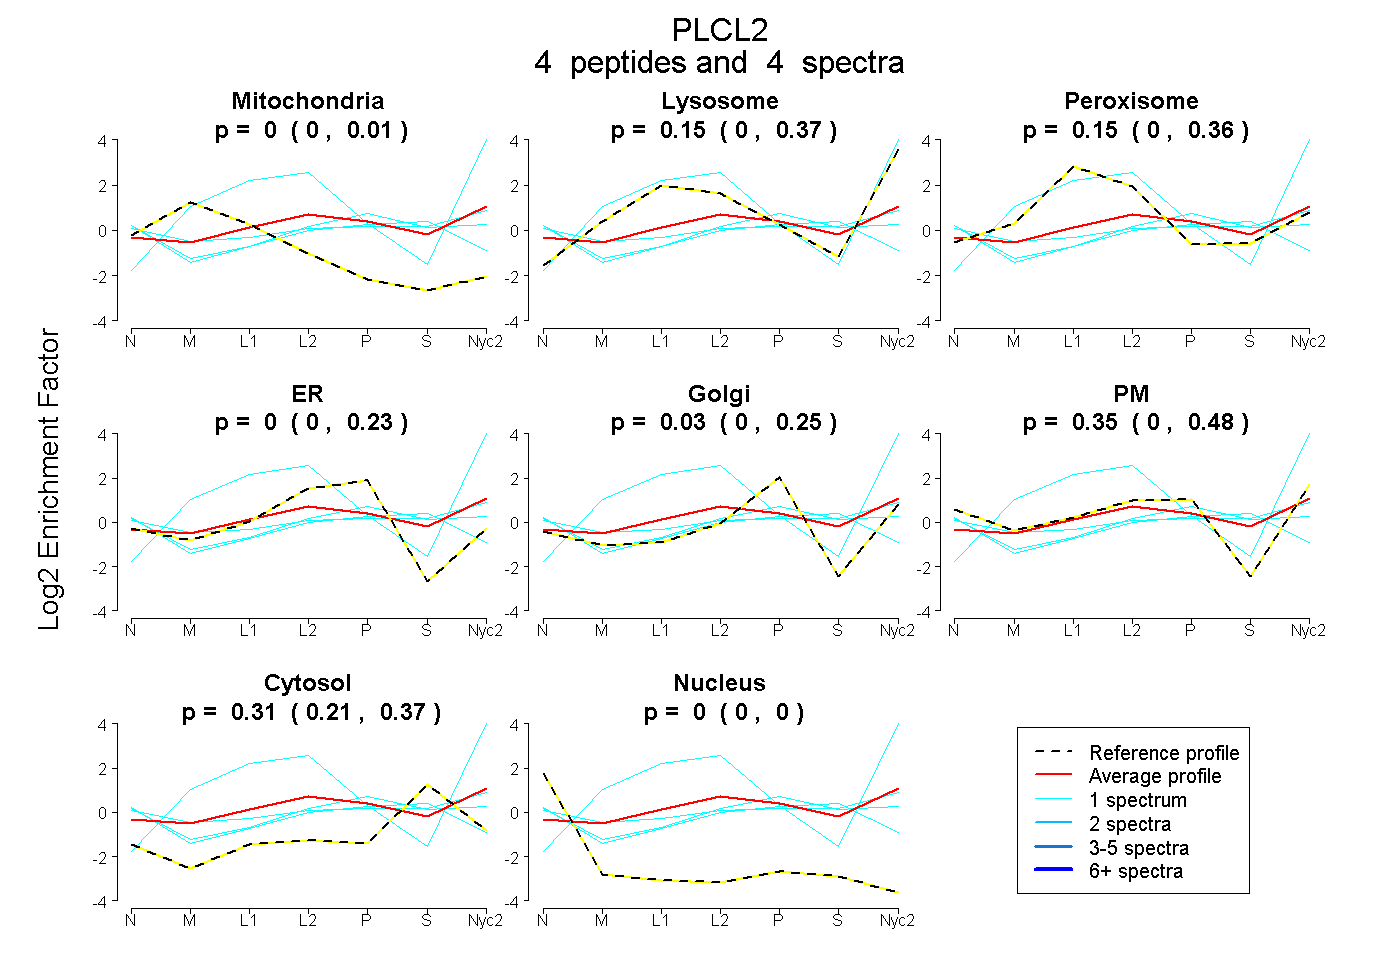
0.000 | 0.006
0.000 | 0.374
0.000 | 0.363
0.000 | 0.231
0.000 | 0.247
0.000 | 0.477
0.205 | 0.368
0.000 | 0.000
| Plot | Mito | Lyso | Perox | ER | Golgi | PM | Cytosol | Nucleus | |||||
| Expt A |
4 peptides |
4 spectra |
|
0.000 0.000 | 0.006 |
0.154 0.000 | 0.374 |
0.155 0.000 | 0.363 |
0.000 0.000 | 0.231 |
0.031 0.000 | 0.247 |
0.355 0.000 | 0.477 |
0.305 0.205 | 0.368 |
0.000 0.000 | 0.000 |
| 1 spectrum, ALIENADAVYEK | 0.000 | 1.000 | 0.000 | 0.000 | 0.000 | 0.000 | 0.000 | 0.000 | ||
| 1 spectrum, NAQPPIR | 0.000 | 0.000 | 0.000 | 0.112 | 0.000 | 0.433 | 0.455 | 0.000 | ||
| 1 spectrum, NTDIFR | 0.000 | 0.071 | 0.099 | 0.000 | 0.000 | 0.426 | 0.404 | 0.000 | ||
| 1 spectrum, IVHCQK | 0.000 | 0.000 | 0.075 | 0.327 | 0.000 | 0.031 | 0.530 | 0.036 |
| Plot | Lyso | Other | |||||||||||
| Expt C |
1 peptide |
1 spectrum |
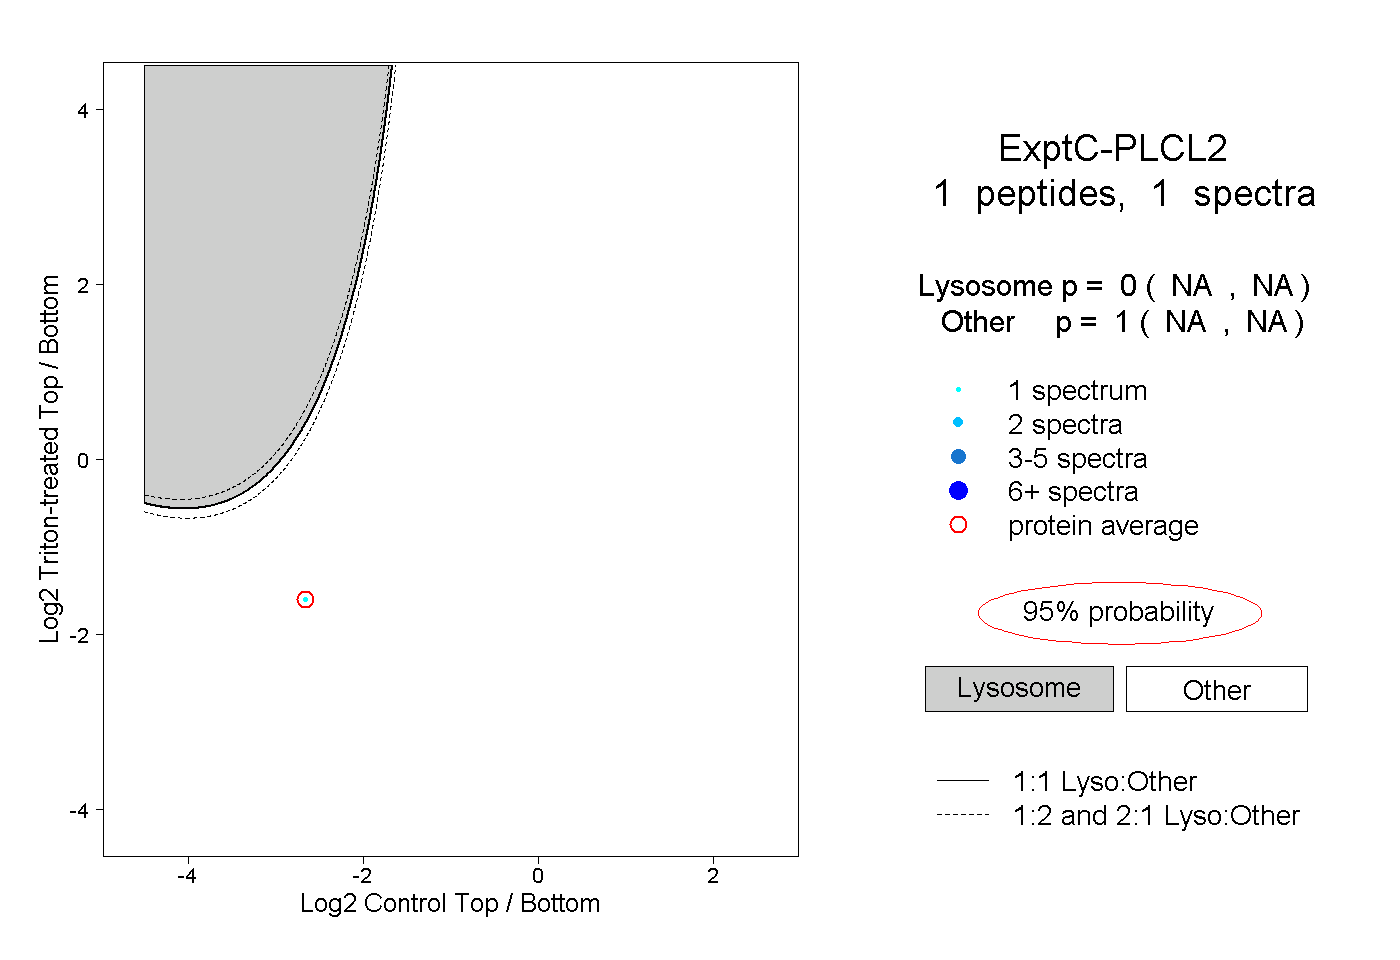 |
0.000 NA | NA |
1.000 NA | NA |
||||||||
| Plot | Lyso | Other | |||||||||||
| Expt D |
1 peptide |
1 spectrum |
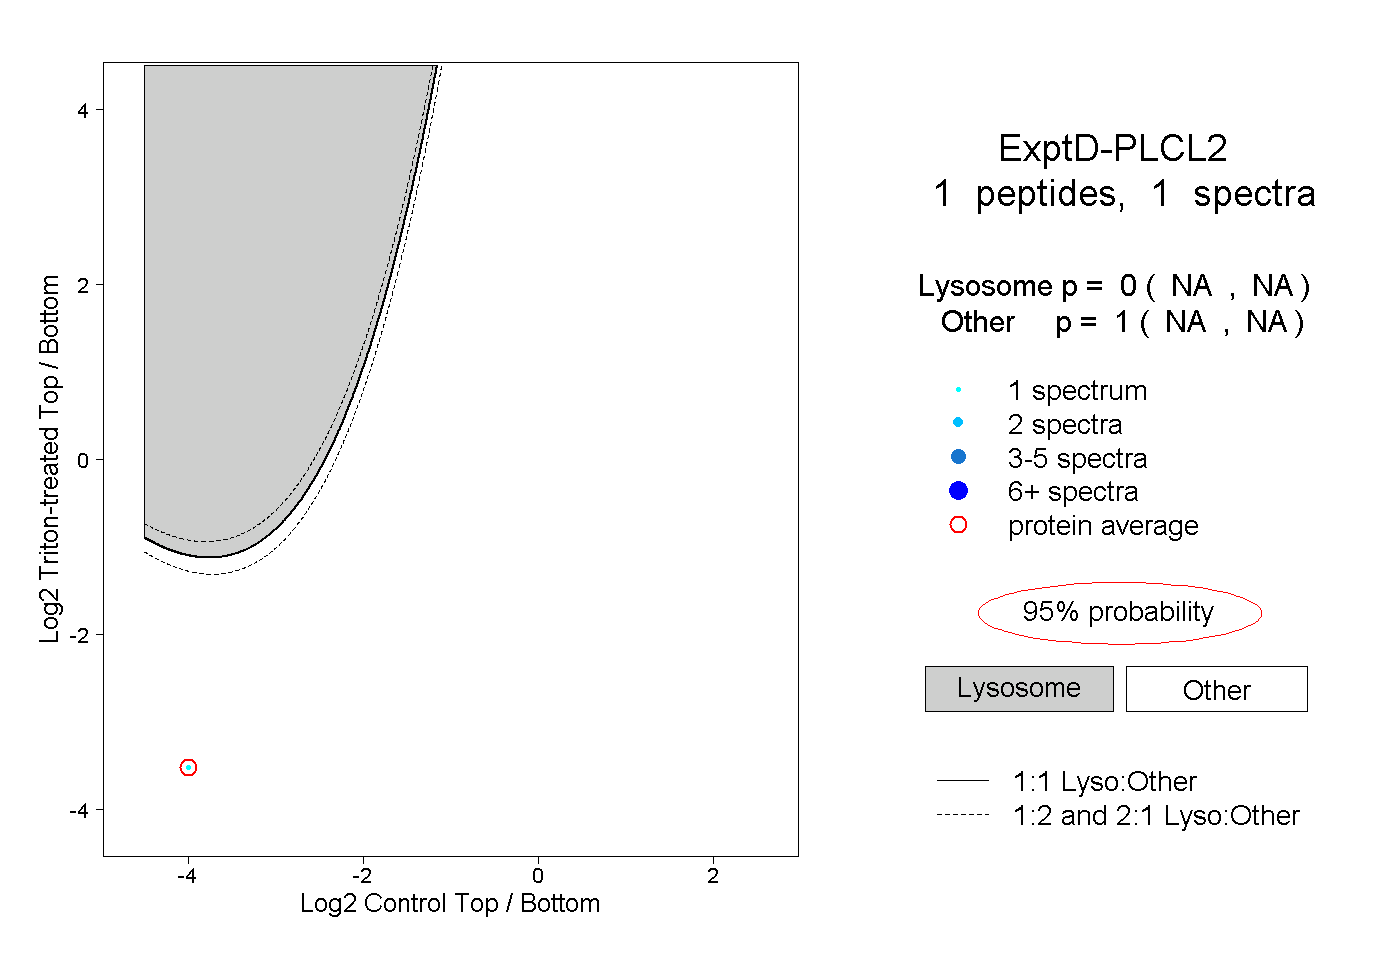 |
0.000 NA | NA |
1.000 NA | NA |