 8
8peptides
spectra
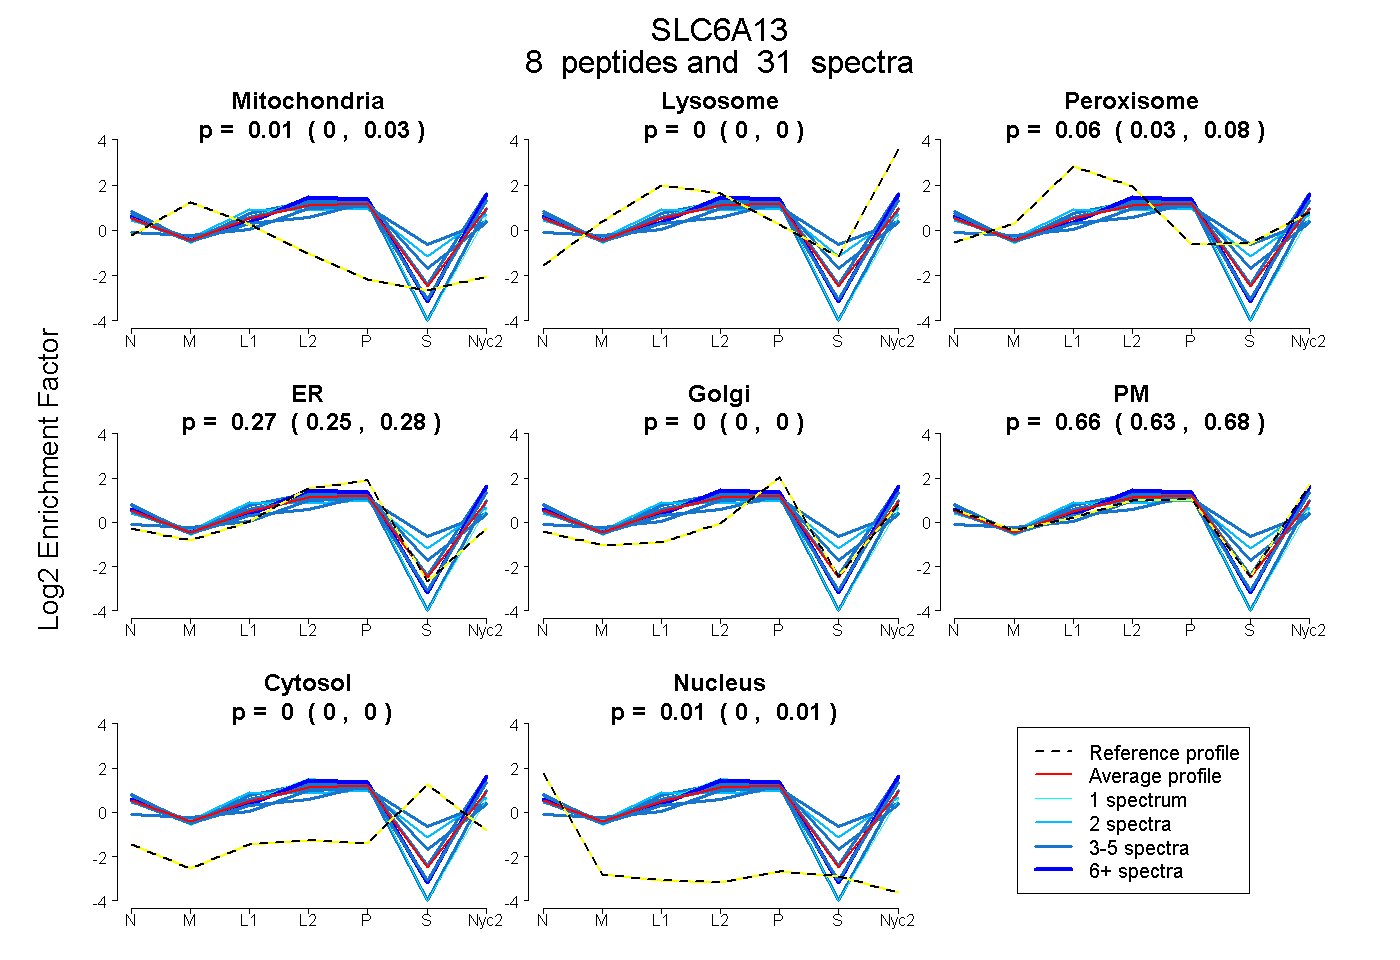
0.000 | 0.025
0.000 | 0.000
0.031 | 0.084
0.245 | 0.283
0.000 | 0.000
0.627 | 0.681
0.000 | 0.000
0.000 | 0.014
2peptides
spectra
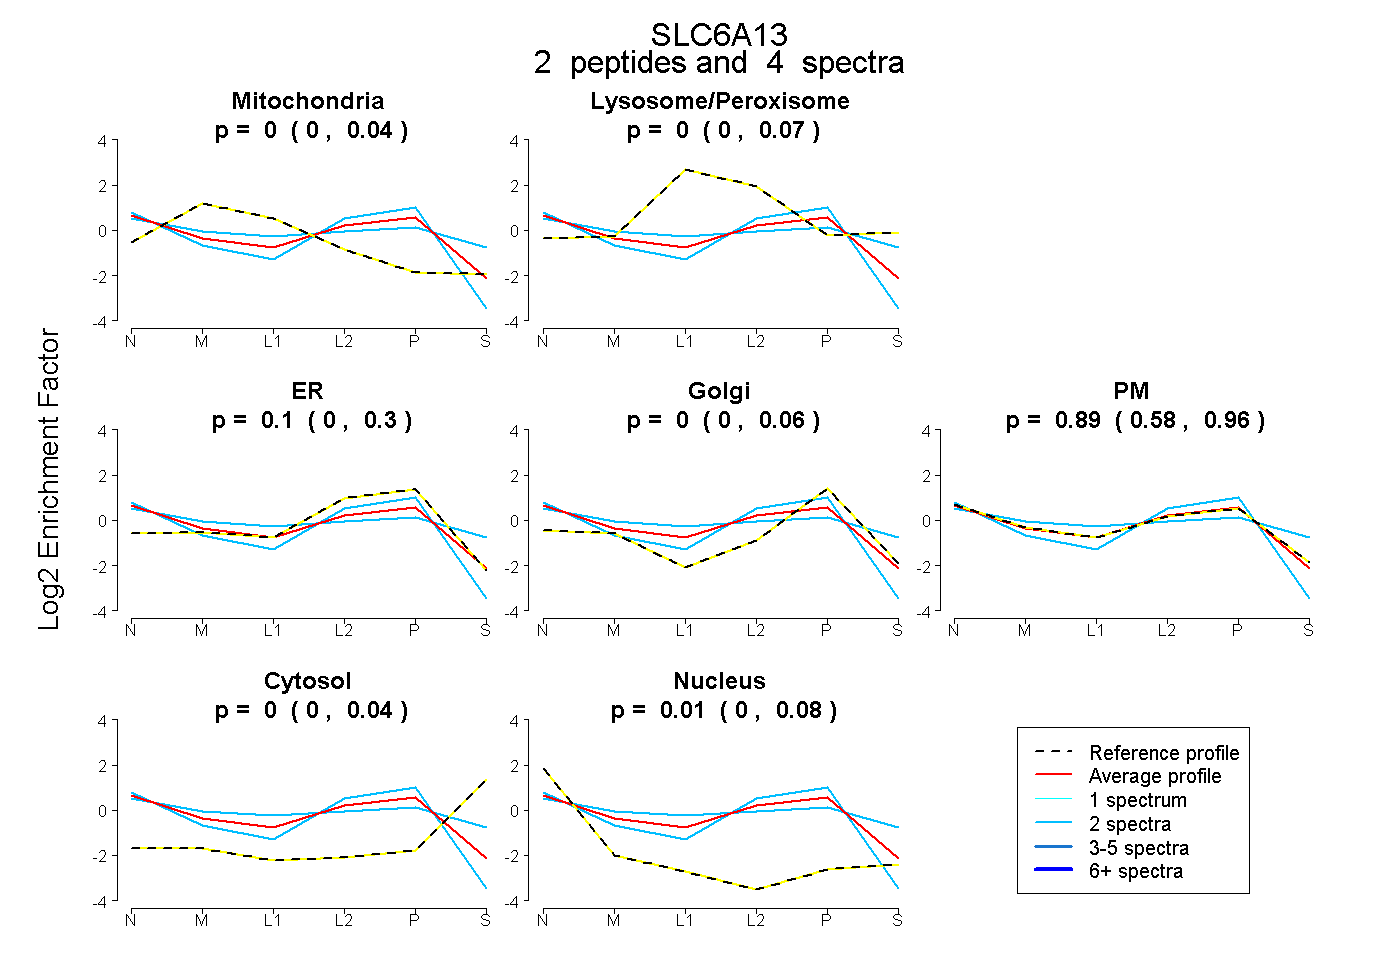
0.000 | 0.043
0.000 | 0.069
0.000 | 0.304
0.000 | 0.059
0.580 | 0.961
0.000 | 0.044
0.000 | 0.076
9peptides
spectra
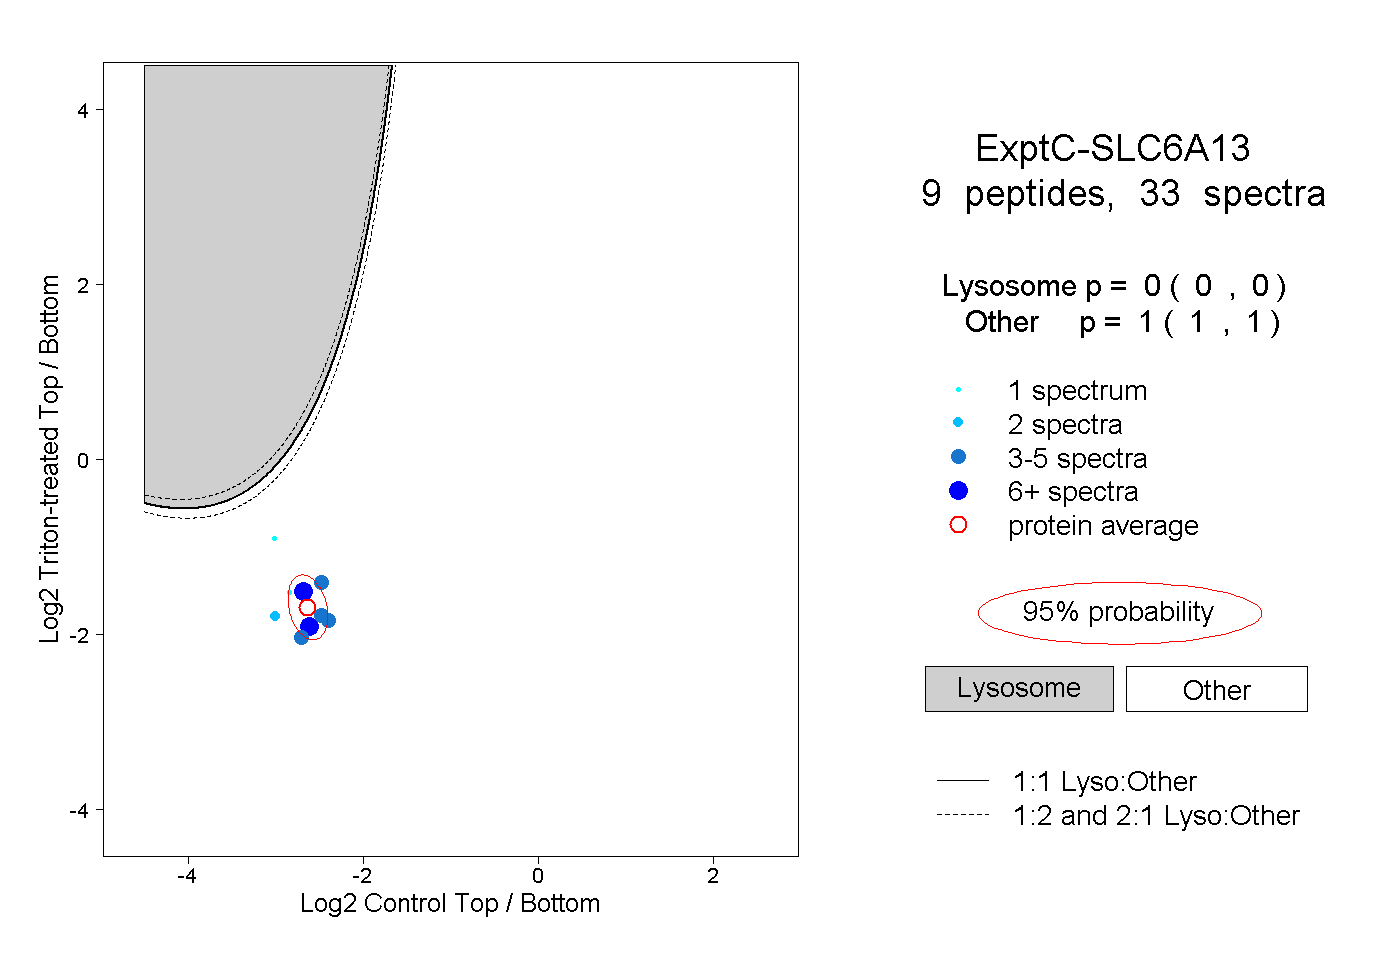
0.000 | 0.000
1.000 | 1.000
1peptide
spectra
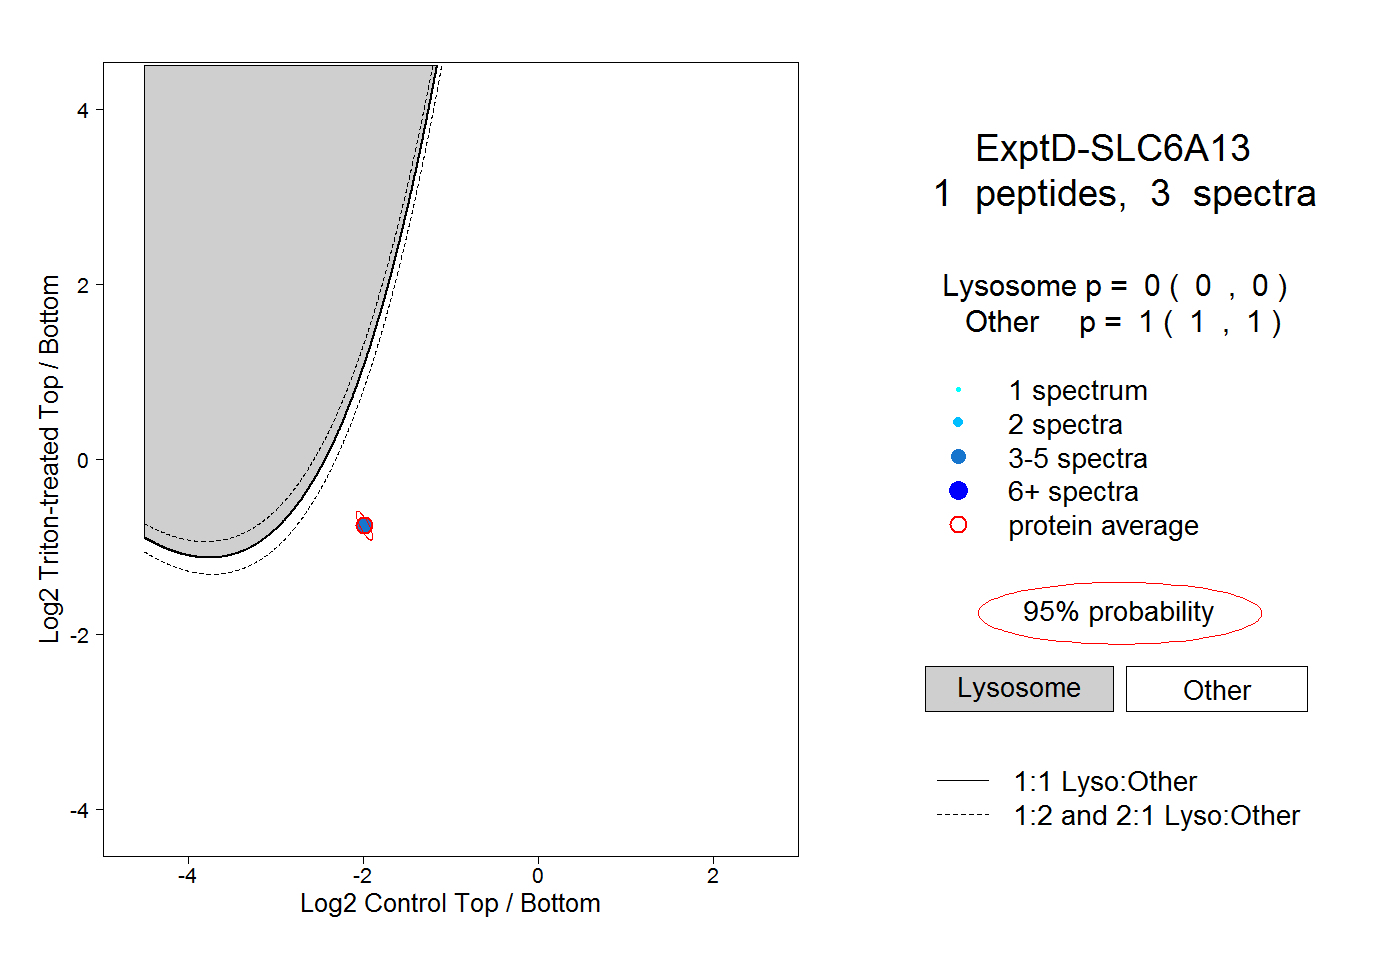
0.000 | 0.000
1.000 | 1.000