 8
8peptides
spectra
0.000 | 0.025
0.000 | 0.000
0.031 | 0.084
0.245 | 0.283
0.000 | 0.000
0.627 | 0.681
0.000 | 0.000
0.000 | 0.014
| Plot | Mito | Lyso | Perox | ER | Golgi | PM | Cytosol | Nucleus | |||||
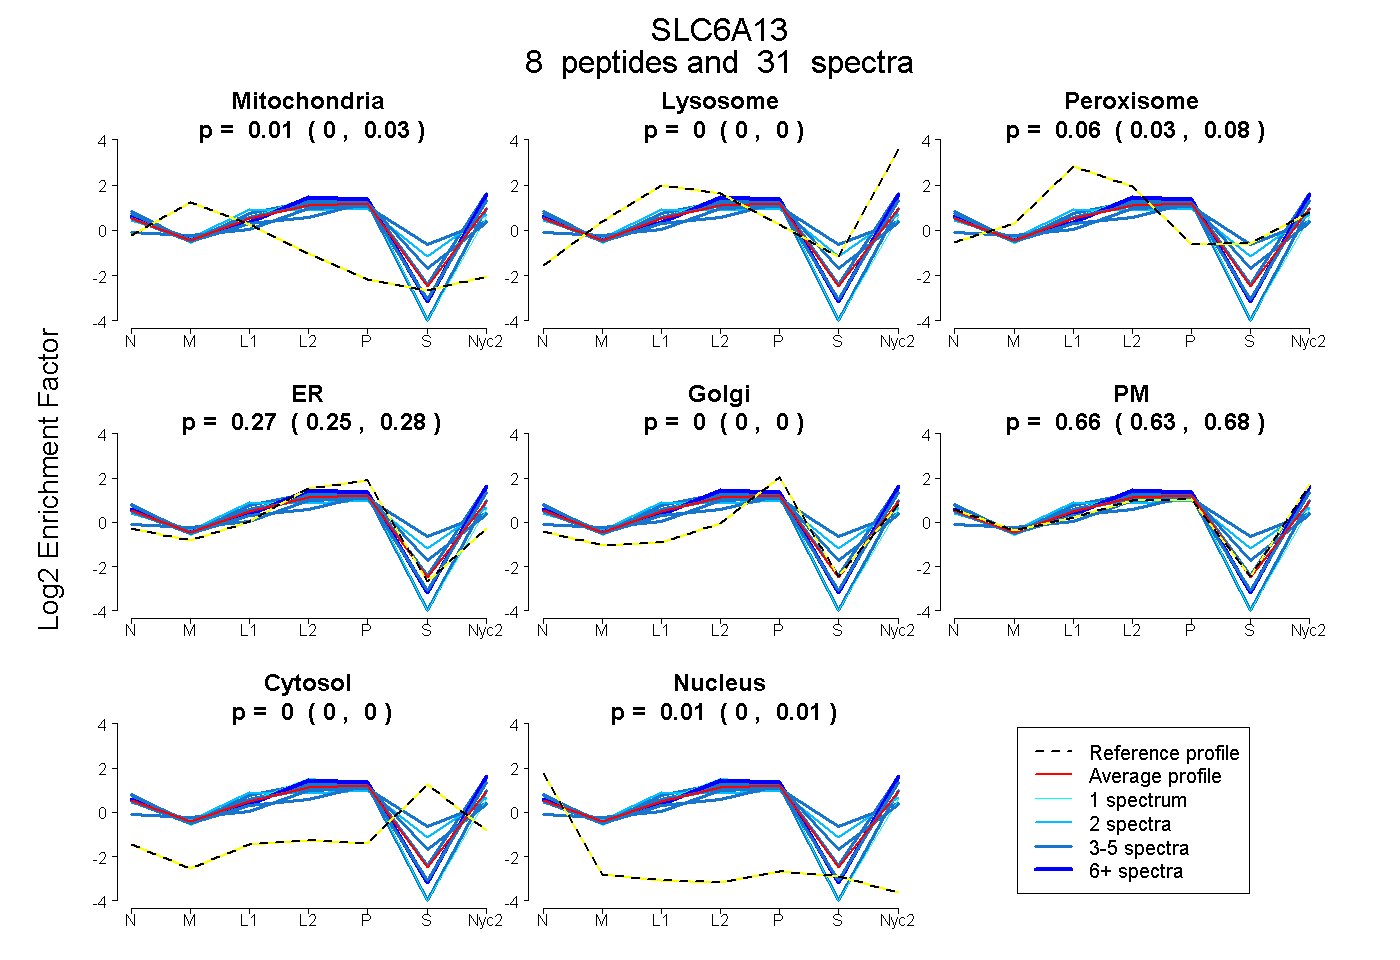
| Expt A |
8 peptides |
31 spectra |
|
0.011 0.000 | 0.025 |
0.000 0.000 | 0.000 |
0.060 0.031 | 0.084 |
0.266 0.245 | 0.283 |
0.000 0.000 | 0.000 |
0.658 0.627 | 0.681 |
0.000 0.000 | 0.000 |
0.006 0.000 | 0.014 |
| 3 spectra, EQWTNK | 0.000 | 0.049 | 0.034 | 0.094 | 0.000 | 0.824 | 0.000 | 0.000 | ||
| 1 spectrum, QLVCPAEDLPQK | 0.010 | 0.000 | 0.000 | 0.490 | 0.000 | 0.500 | 0.000 | 0.000 | ||
| 3 spectra, FPYLCYK | 0.014 | 0.000 | 0.000 | 0.293 | 0.000 | 0.693 | 0.000 | 0.000 | ||
| 2 spectra, ISDGIQHLGSLR | 0.000 | 0.000 | 0.321 | 0.109 | 0.128 | 0.369 | 0.070 | 0.002 | ||
| 3 spectra, LTELESNC | 0.000 | 0.000 | 0.263 | 0.212 | 0.188 | 0.173 | 0.164 | 0.000 | ||
| 11 spectra, VEEDGTLER | 0.000 | 0.000 | 0.000 | 0.142 | 0.000 | 0.858 | 0.000 | 0.000 | ||
| 4 spectra, YTPLTYNK | 0.009 | 0.000 | 0.000 | 0.131 | 0.000 | 0.860 | 0.000 | 0.000 | ||
| 4 spectra, YHNNCYR | 0.000 | 0.000 | 0.212 | 0.185 | 0.253 | 0.281 | 0.000 | 0.069 |
| Plot | Mito | Lyso or Perox | ER | Golgi | PM | Cytosol | Nucleus | ||||||
| Expt B |
2 peptides |
4 spectra |
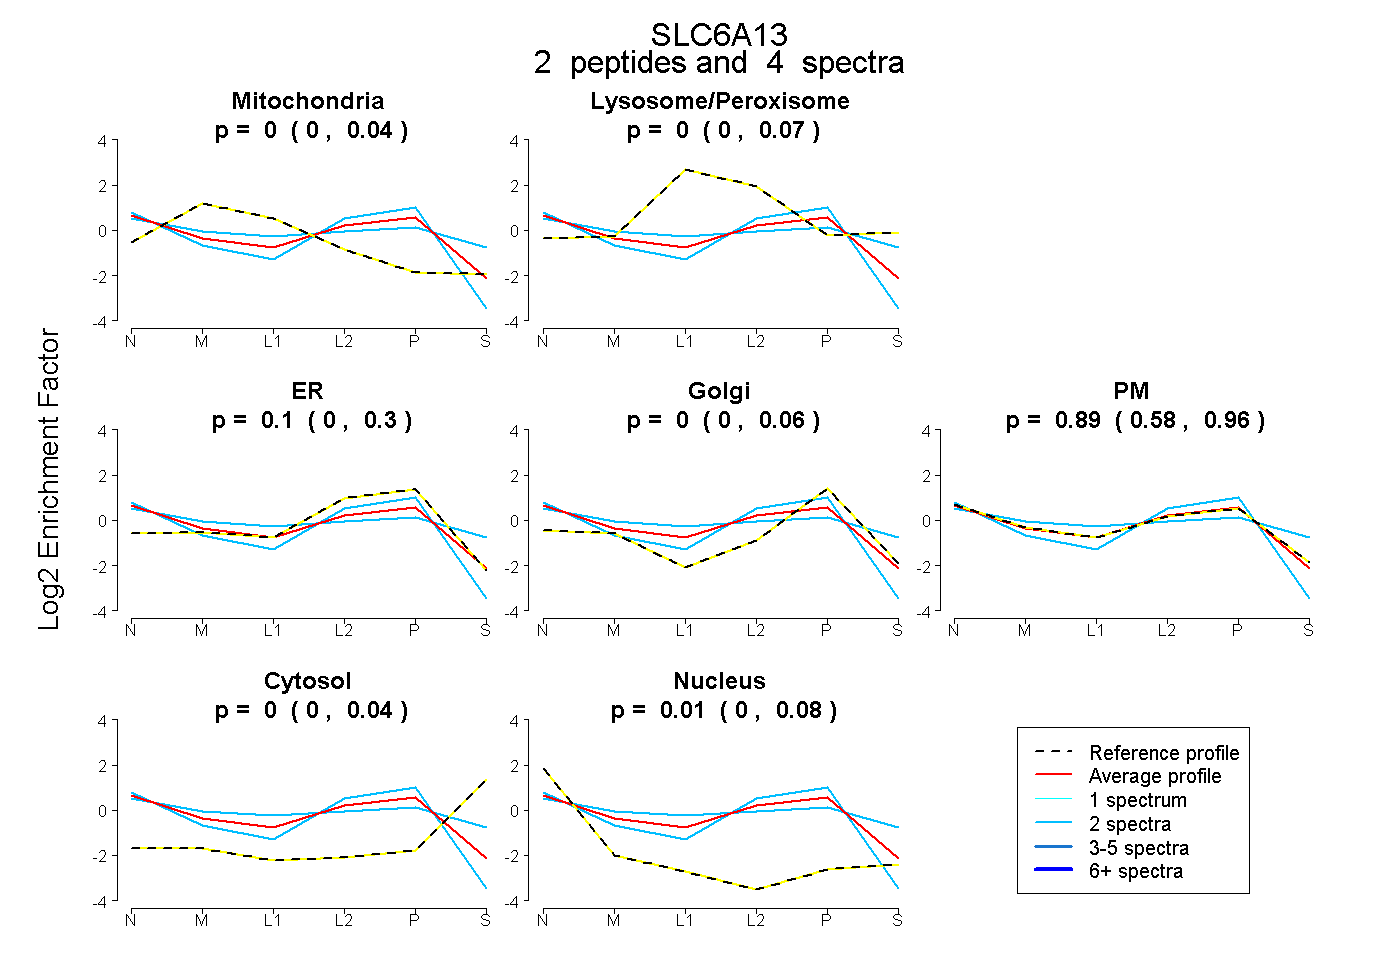 |
0.000 0.000 | 0.043 |
0.000 0.000 | 0.069 |
0.097 0.000 | 0.304 |
0.000 0.000 | 0.059 |
0.890 0.580 | 0.961 |
0.000 0.000 | 0.044 |
0.013 0.000 | 0.076 |
|||
| Plot | Lyso | Other | |||||||||||
| Expt C |
9 peptides |
33 spectra |
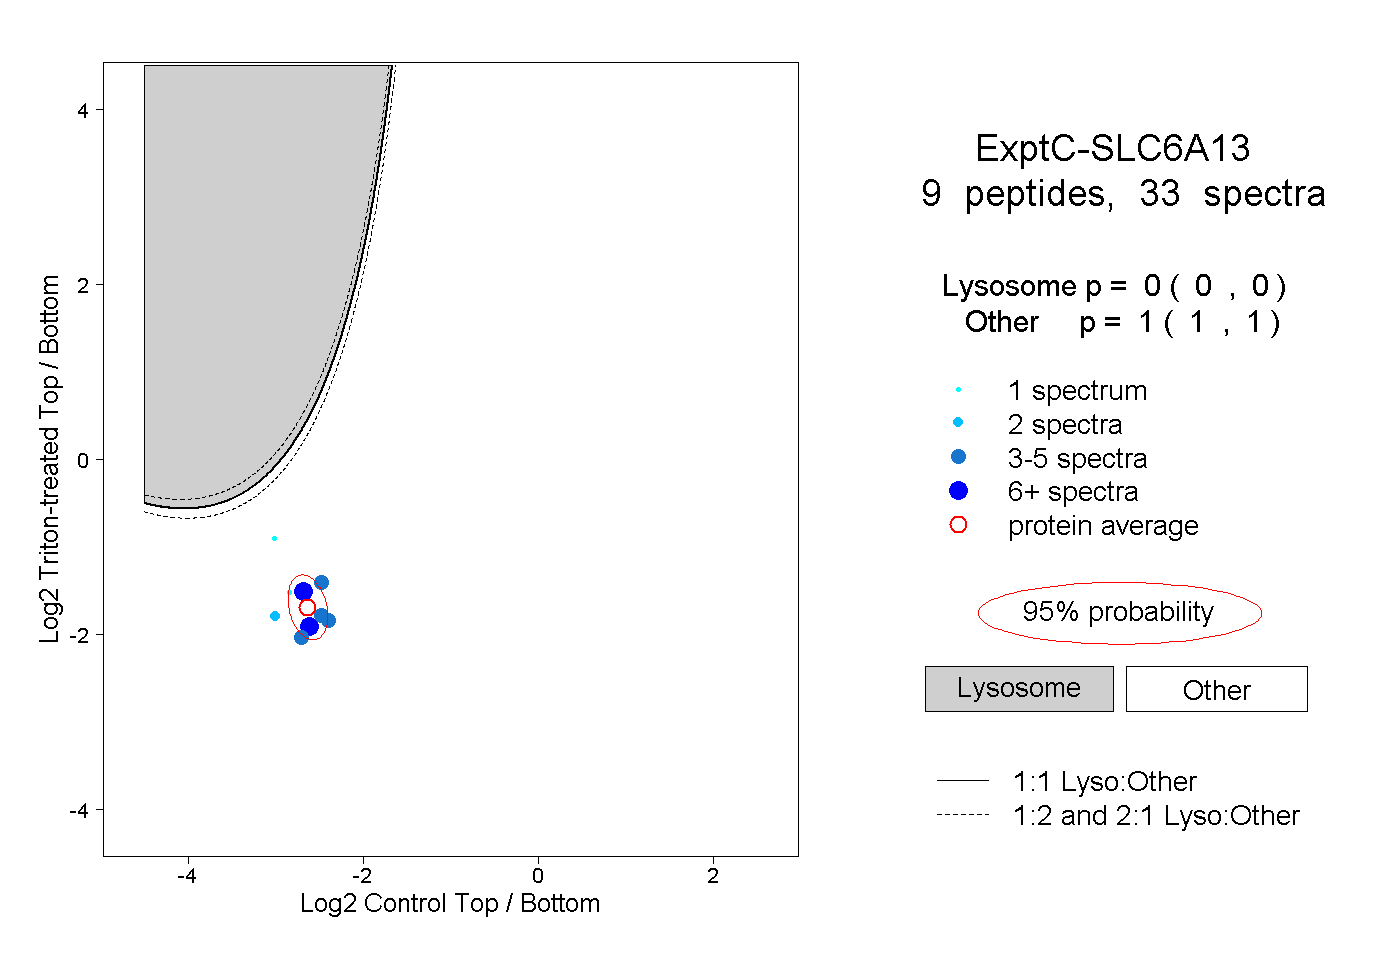 |
0.000 0.000 | 0.000 |
1.000 1.000 | 1.000 |
||||||||
| Plot | Lyso | Other | |||||||||||
| Expt D |
1 peptide |
3 spectra |
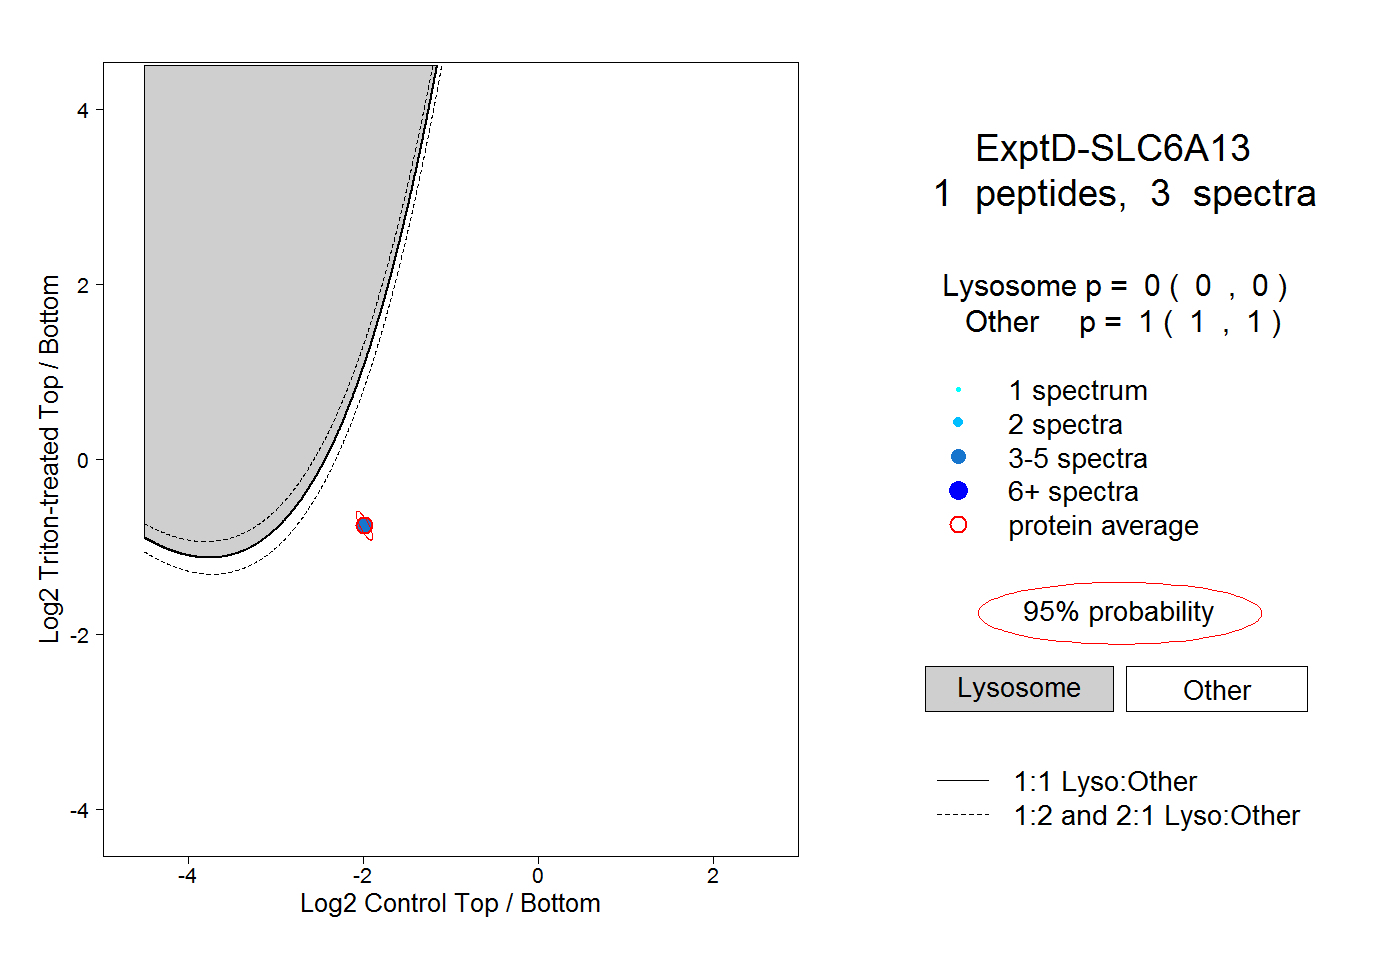 |
0.000 0.000 | 0.000 |
1.000 1.000 | 1.000 |