 6
6peptides
spectra
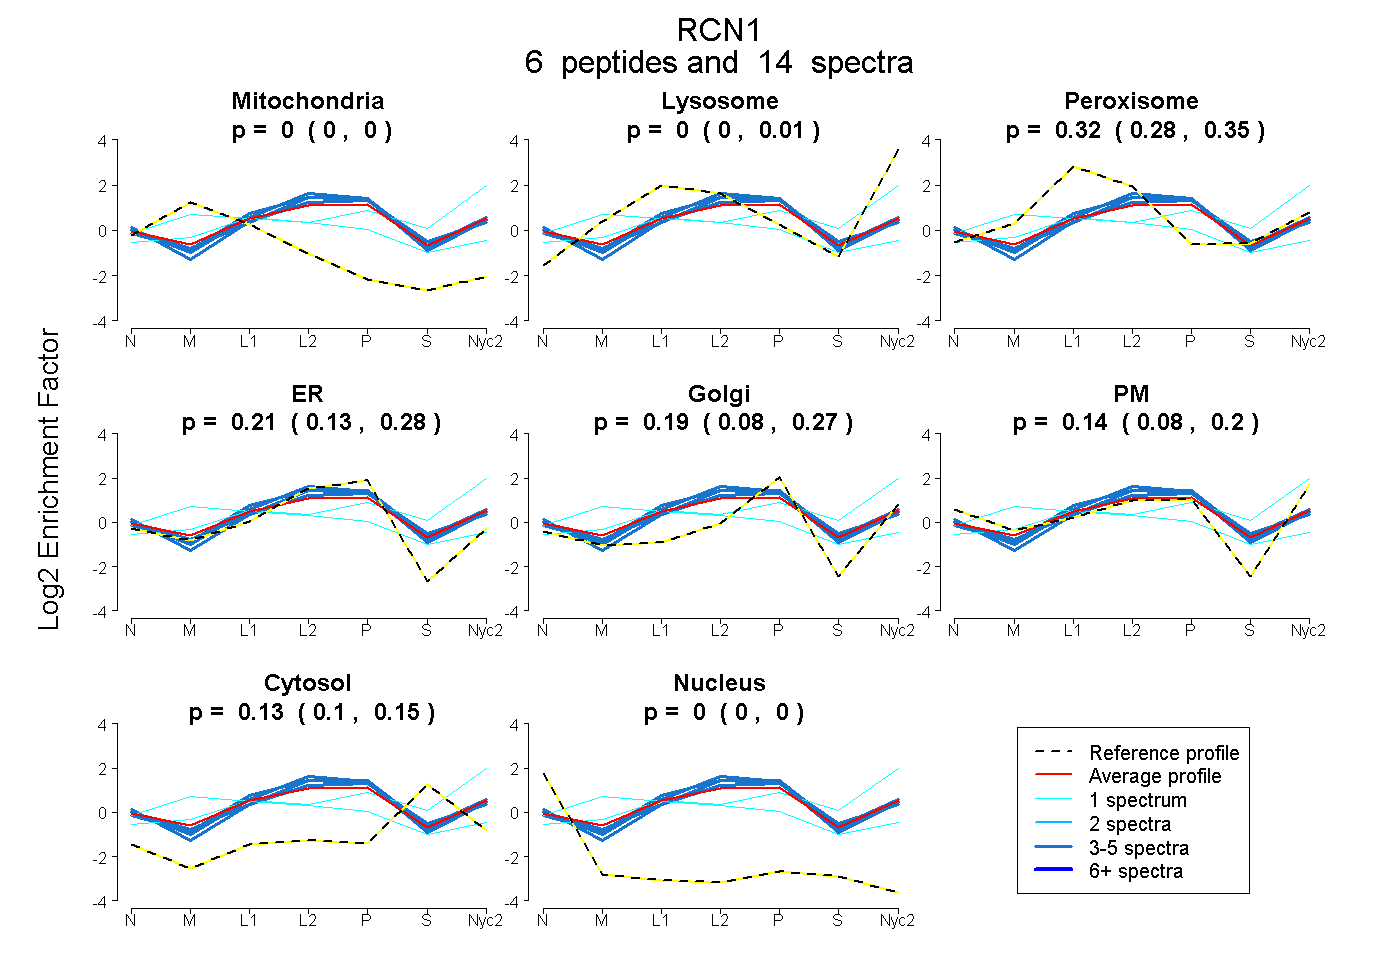
0.000 | 0.000
0.000 | 0.011
0.278 | 0.349
0.127 | 0.282
0.082 | 0.272
0.082 | 0.196
0.105 | 0.155
0.000 | 0.000
7peptides
spectra
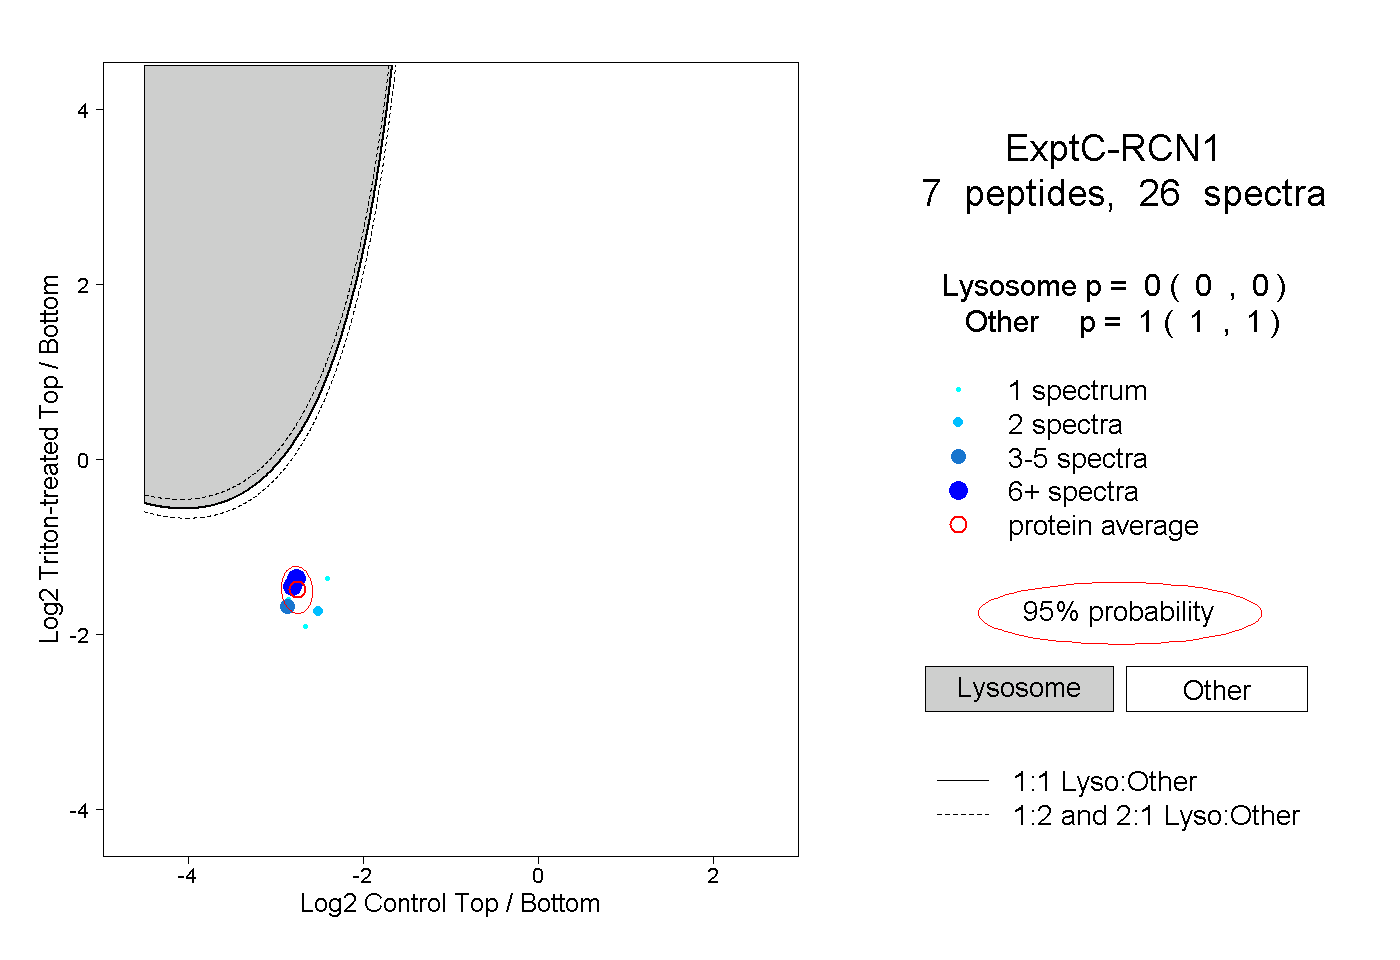
0.000 | 0.000
1.000 | 1.000
2peptides
spectra
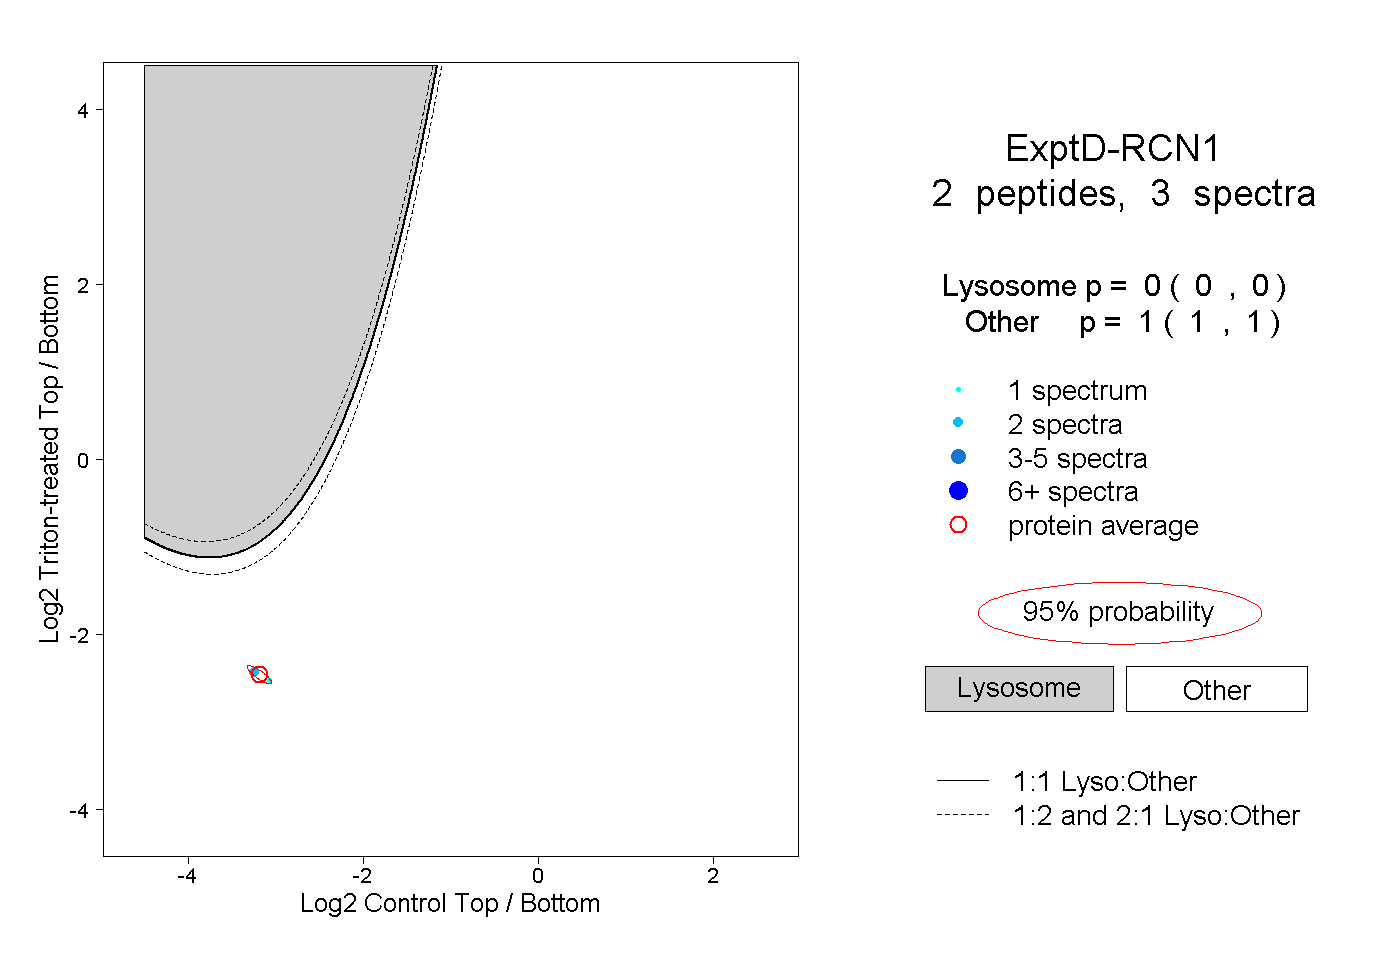
0.000 | 0.000
1.000 | 1.000