 6
6peptides
spectra
0.000 | 0.000
0.000 | 0.011
0.278 | 0.349
0.127 | 0.282
0.082 | 0.272
0.082 | 0.196
0.105 | 0.155
0.000 | 0.000
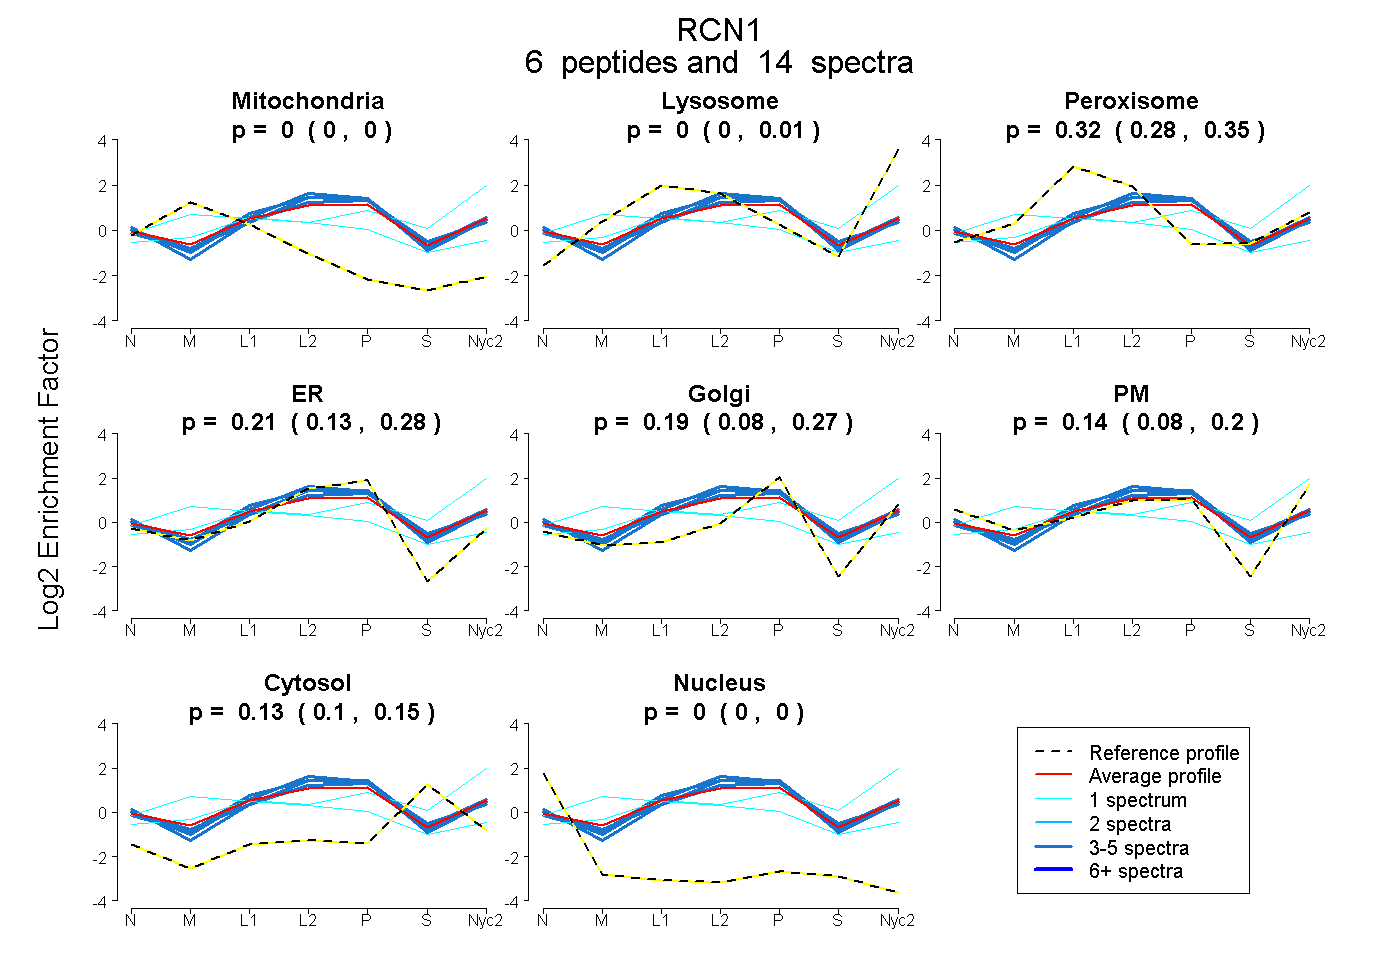
| Plot | Mito | Lyso | Perox | ER | Golgi | PM | Cytosol | Nucleus | |||||
| Expt A |
6 peptides |
14 spectra |
|
0.000 0.000 | 0.000 |
0.000 0.000 | 0.011 |
0.322 0.278 | 0.349 |
0.208 0.127 | 0.282 |
0.195 0.082 | 0.272 |
0.144 0.082 | 0.196 |
0.131 0.105 | 0.155 |
0.000 0.000 | 0.000 |
| 1 spectrum, HWILPQDYDHAQAEAR | 0.000 | 0.481 | 0.002 | 0.000 | 0.130 | 0.129 | 0.258 | 0.000 | ||
| 3 spectra, ISWEEYK | 0.000 | 0.030 | 0.181 | 0.469 | 0.000 | 0.185 | 0.136 | 0.000 | ||
| 3 spectra, EQFNDFR | 0.000 | 0.040 | 0.226 | 0.487 | 0.000 | 0.125 | 0.122 | 0.000 | ||
| 3 spectra, ASDLDGDLTATR | 0.000 | 0.000 | 0.184 | 0.403 | 0.000 | 0.199 | 0.214 | 0.000 | ||
| 3 spectra, EEFTAFLHPEEFEHMK | 0.000 | 0.083 | 0.263 | 0.430 | 0.073 | 0.036 | 0.116 | 0.000 | ||
| 1 spectrum, TFDQLSPDESK | 0.304 | 0.000 | 0.342 | 0.057 | 0.230 | 0.000 | 0.068 | 0.000 |
| Plot | Lyso | Other | |||||||||||
| Expt C |
7 peptides |
26 spectra |
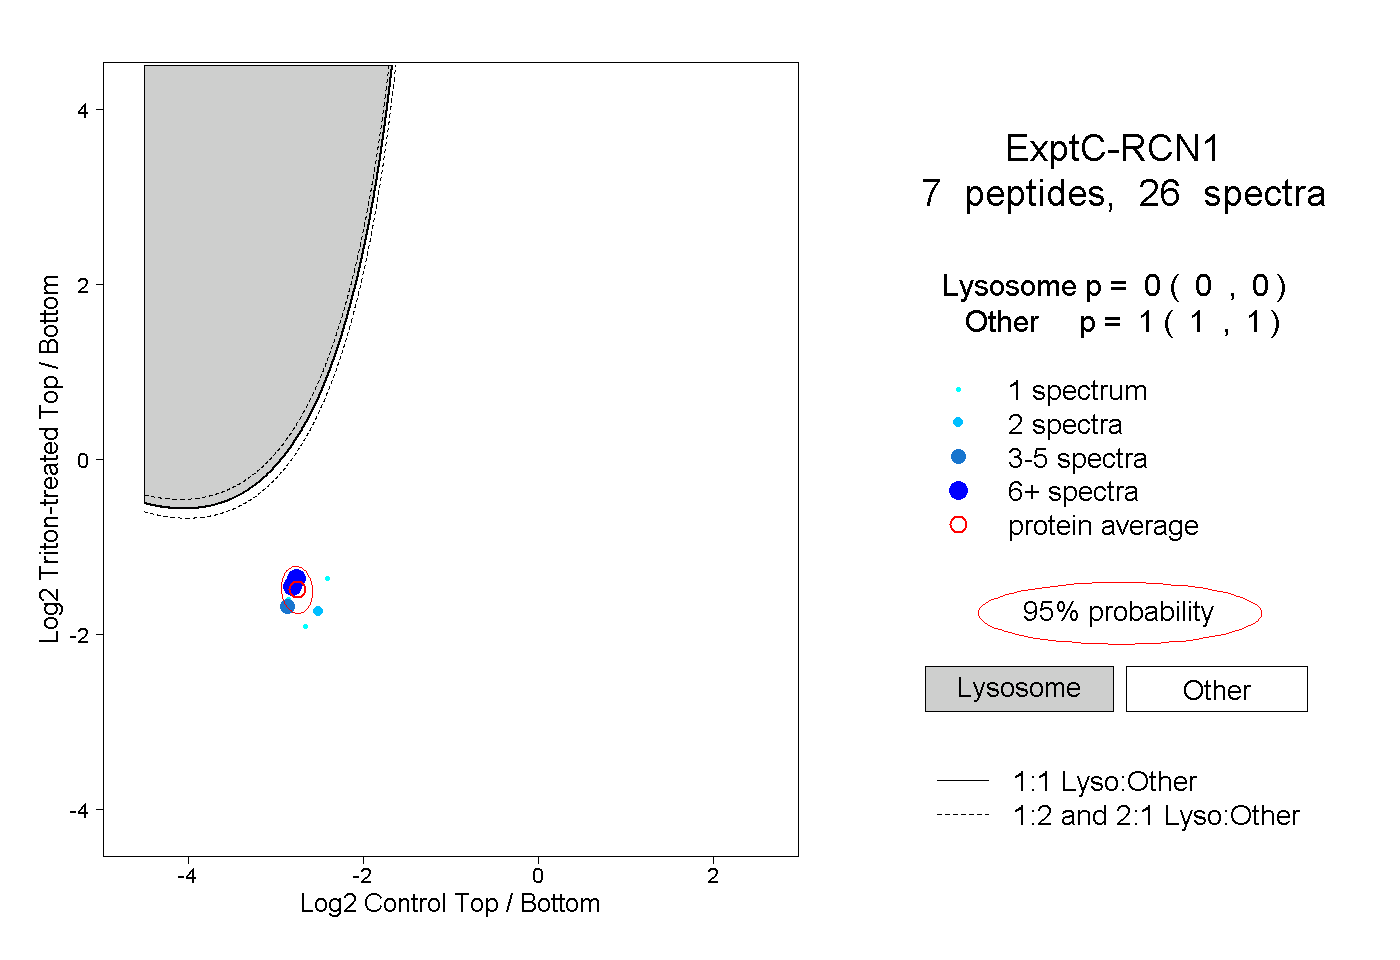 |
0.000 0.000 | 0.000 |
1.000 1.000 | 1.000 |
||||||||
| Plot | Lyso | Other | |||||||||||
| Expt D |
2 peptides |
3 spectra |
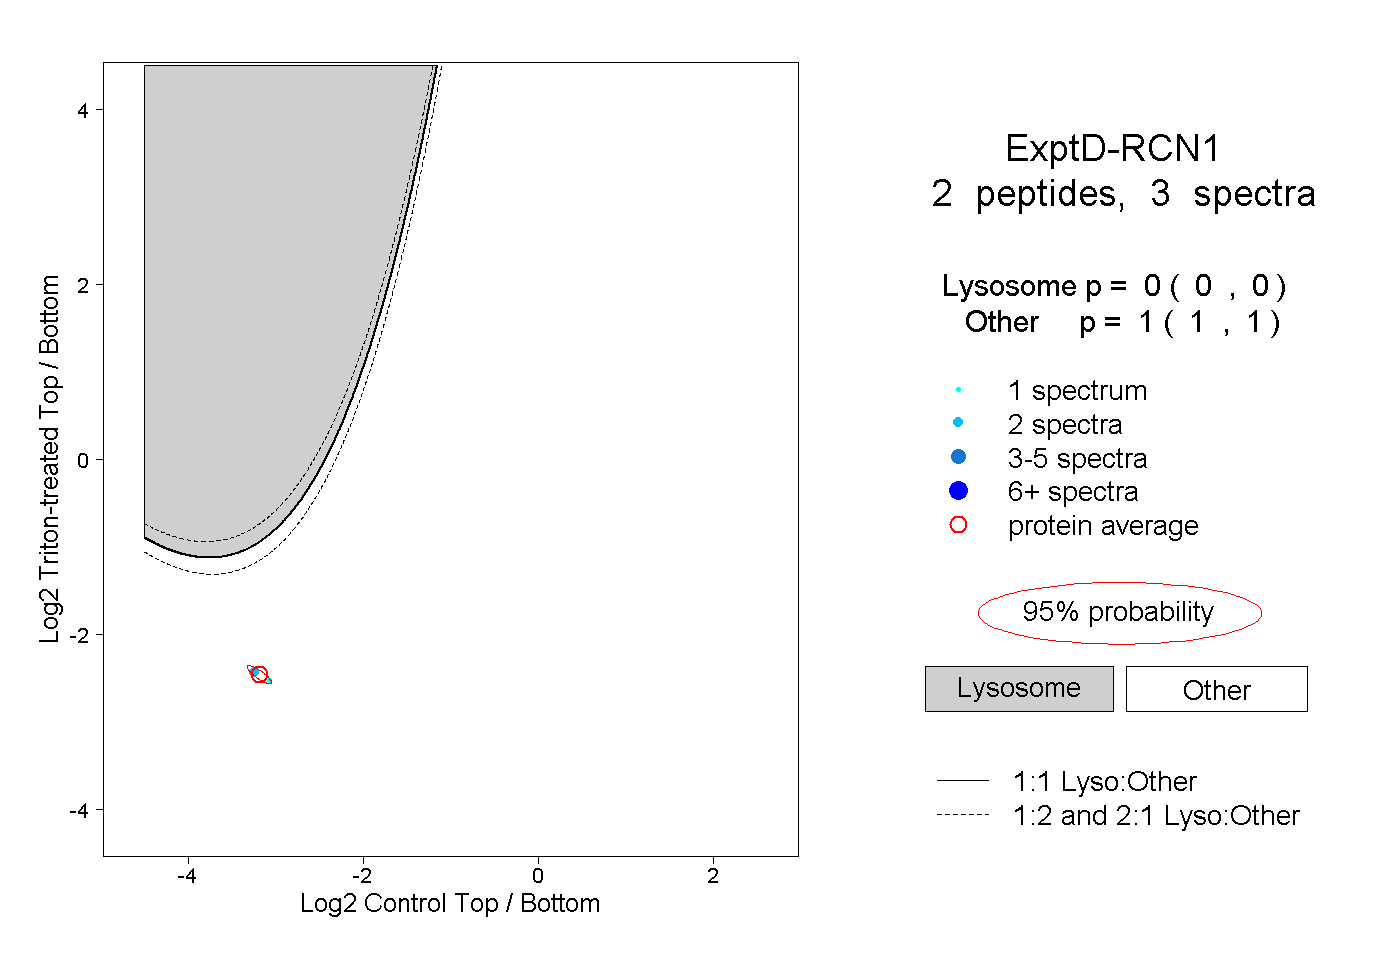 |
0.000 0.000 | 0.000 |
1.000 1.000 | 1.000 |