 41
41peptides
spectra
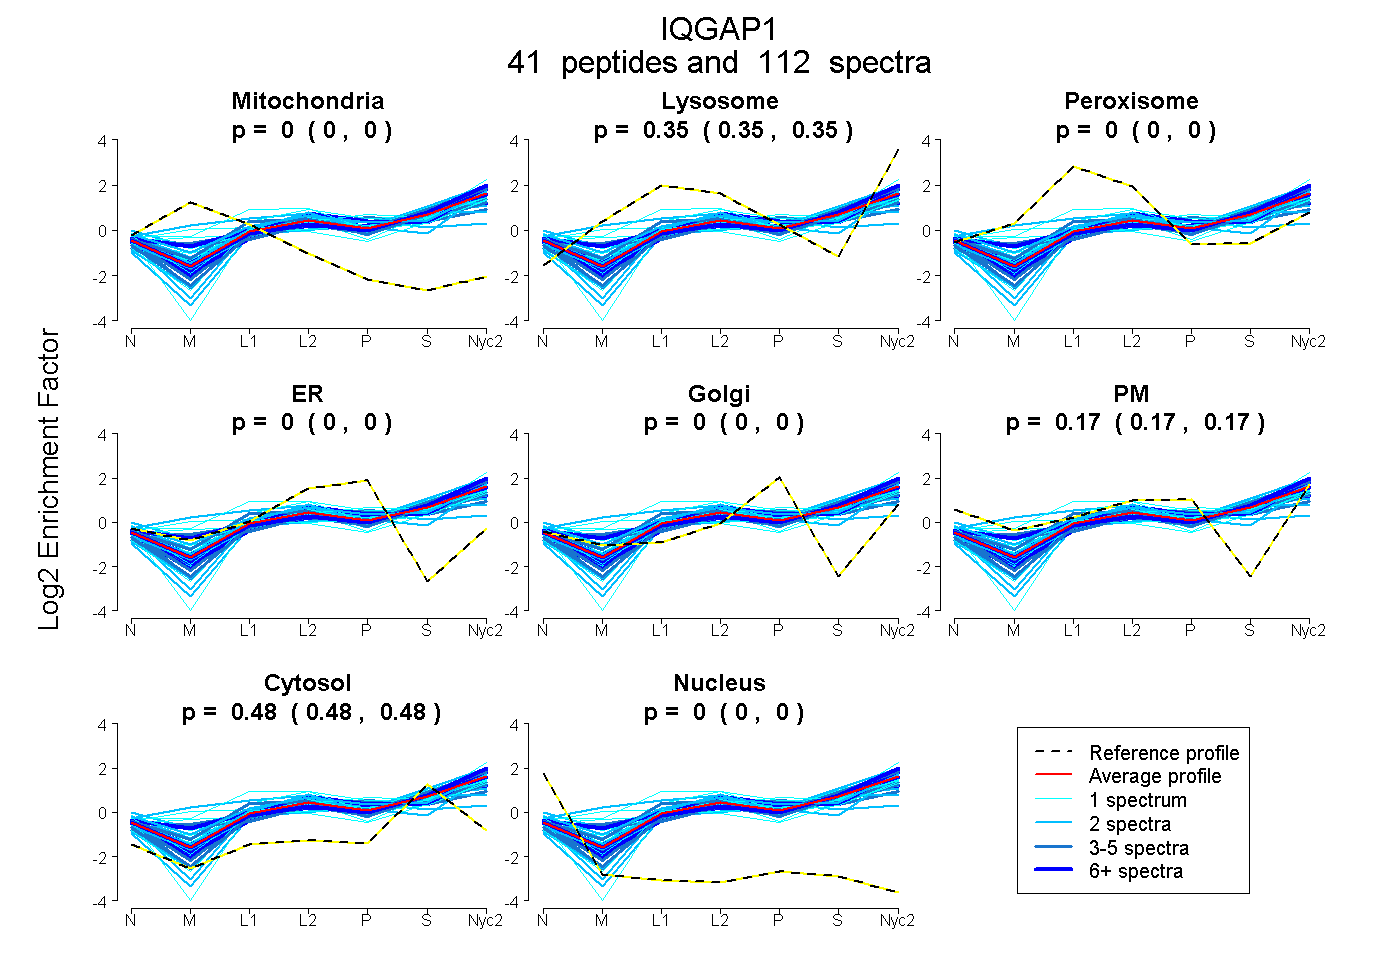
0.000 | 0.000
0.345 | 0.350
0.000 | 0.000
0.000 | 0.000
0.000 | 0.000
0.168 | 0.172
0.481 | 0.484
0.000 | 0.000
11peptides
spectra
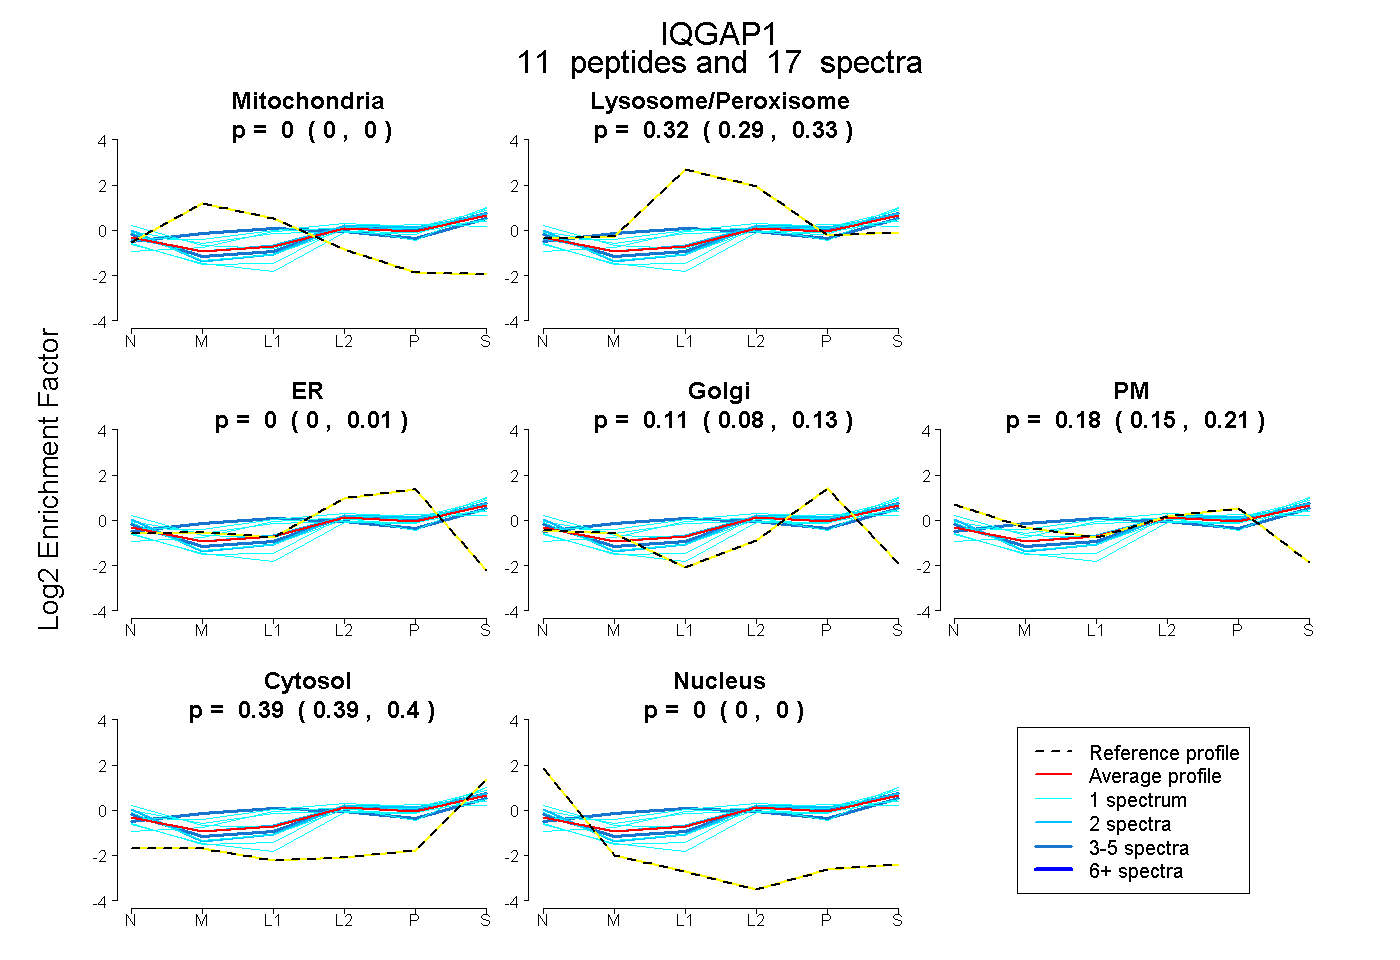
0.000 | 0.000
0.291 | 0.331
0.000 | 0.015
0.076 | 0.127
0.149 | 0.212
0.386 | 0.403
0.000 | 0.000
39peptides
spectra
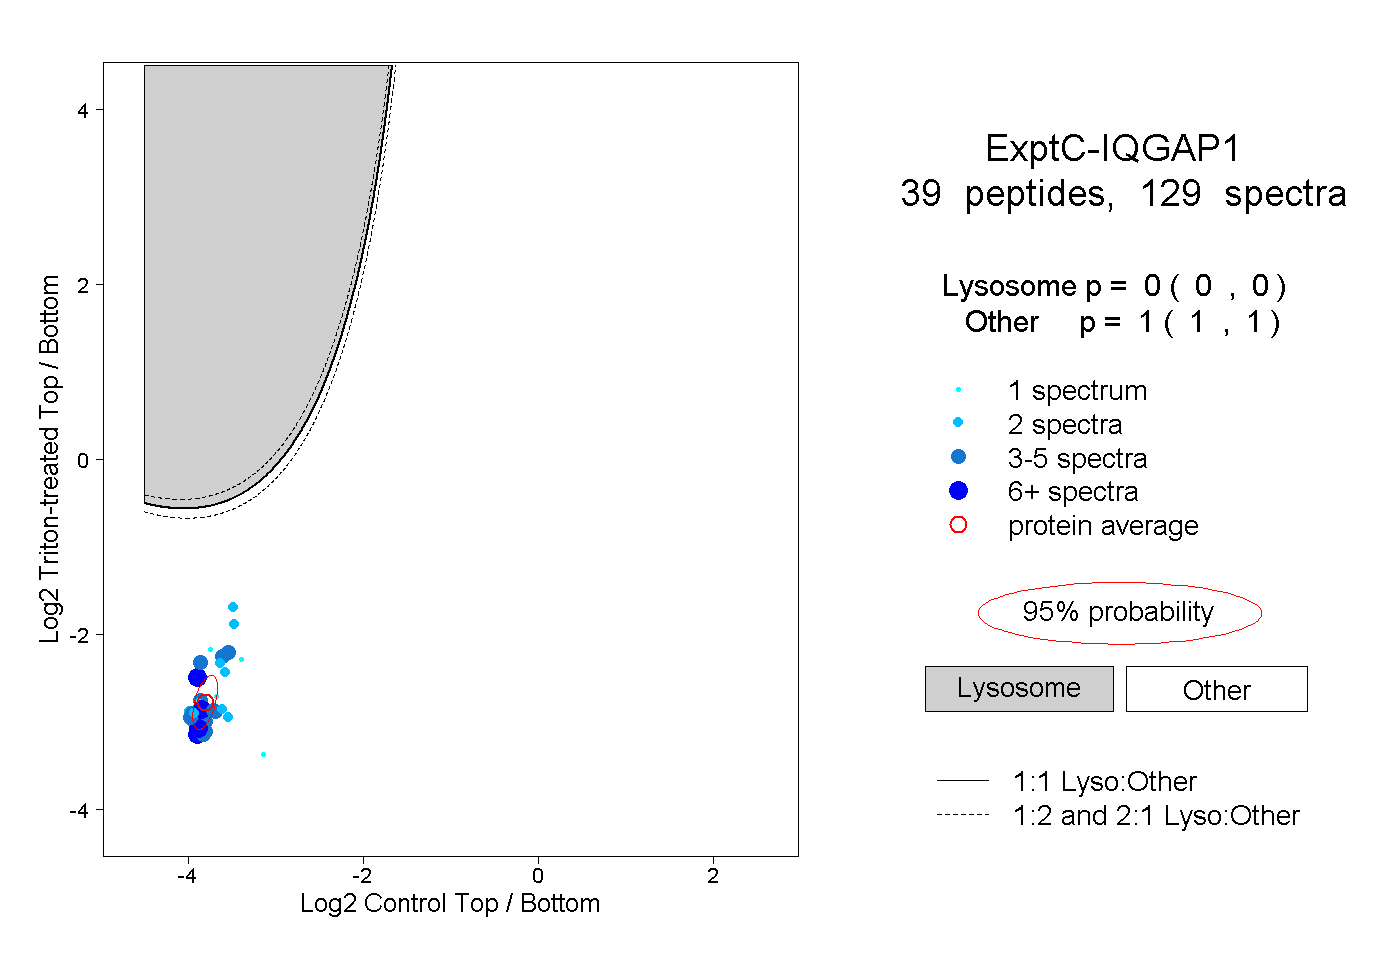
0.000 | 0.000
1.000 | 1.000
8peptides
spectra
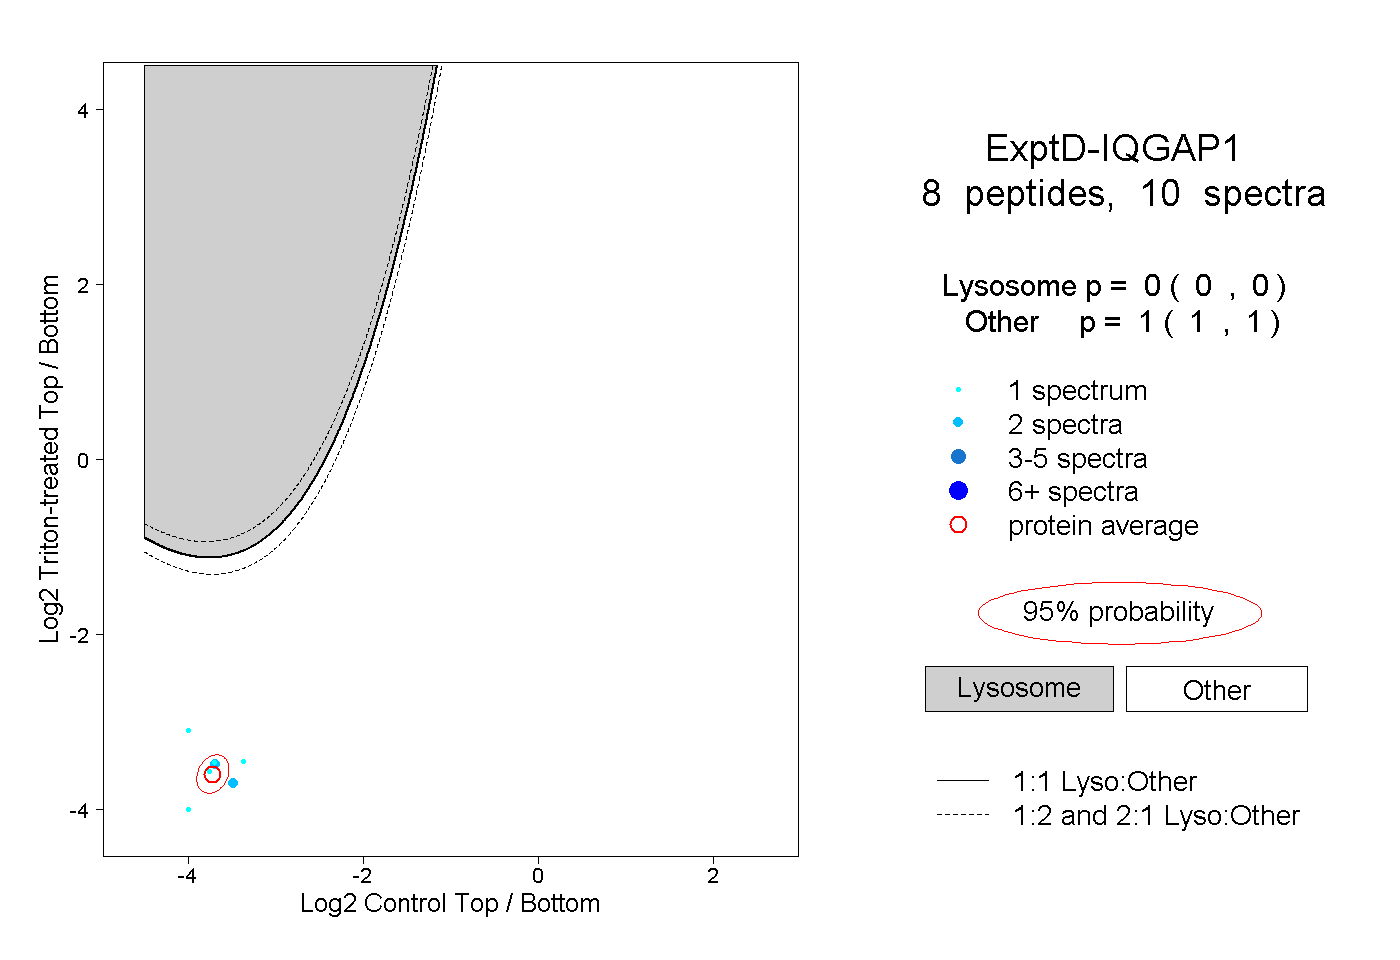
0.000 | 0.000
1.000 | 1.000