 8
8peptides
spectra
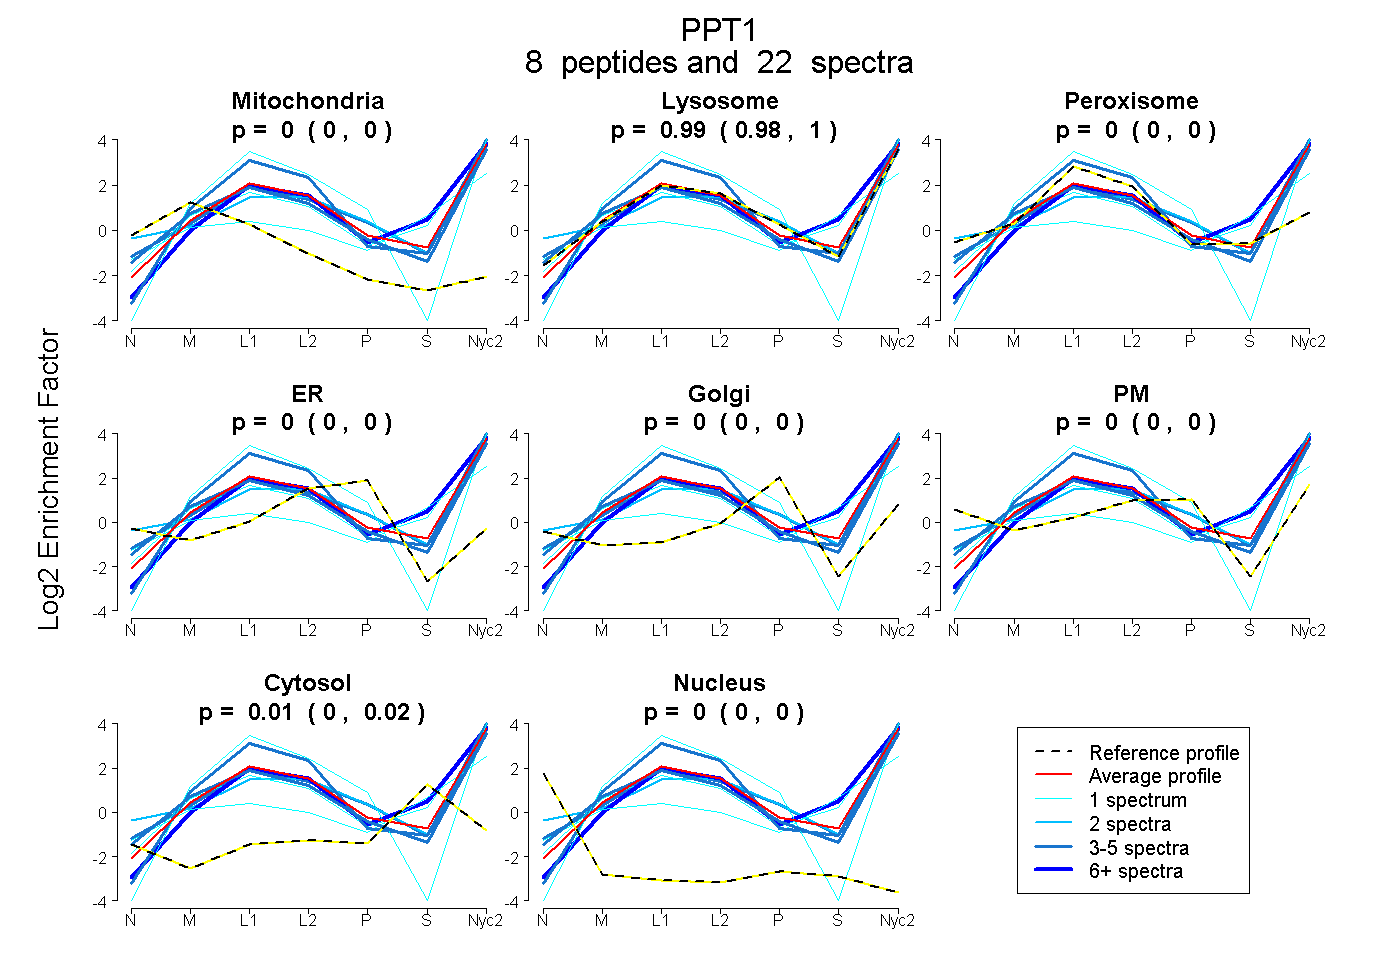
0.000 | 0.000
0.980 | 1.000
0.000 | 0.000
0.000 | 0.000
0.000 | 0.000
0.000 | 0.000
0.000 | 0.019
0.000 | 0.000
7peptides
spectra
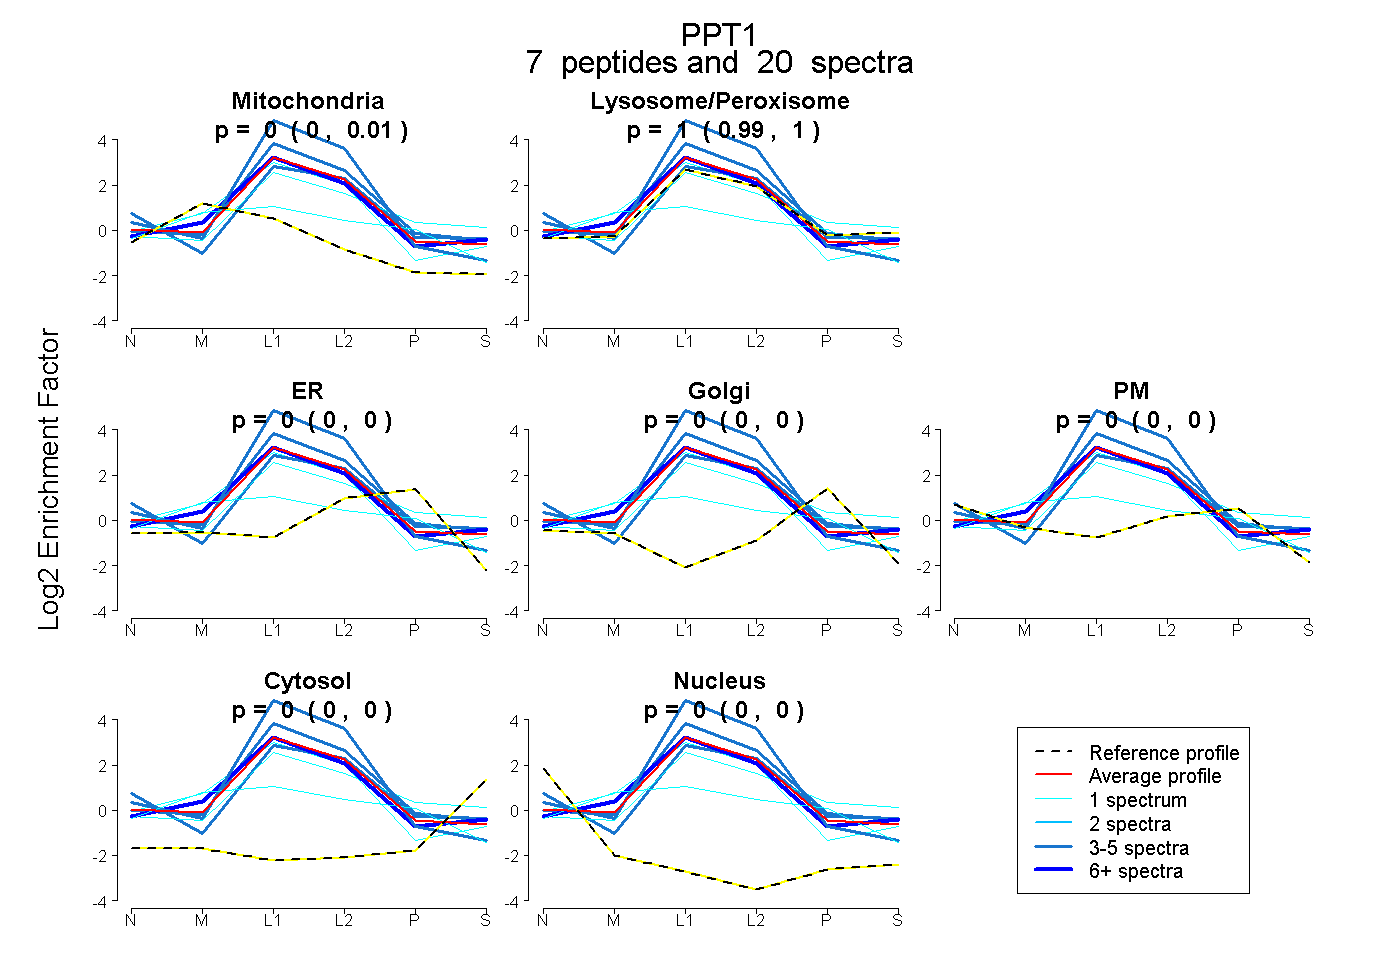
0.000 | 0.007
0.989 | 1.000
0.000 | 0.000
0.000 | 0.000
0.000 | 0.000
0.000 | 0.000
0.000 | 0.000
10peptides
spectra
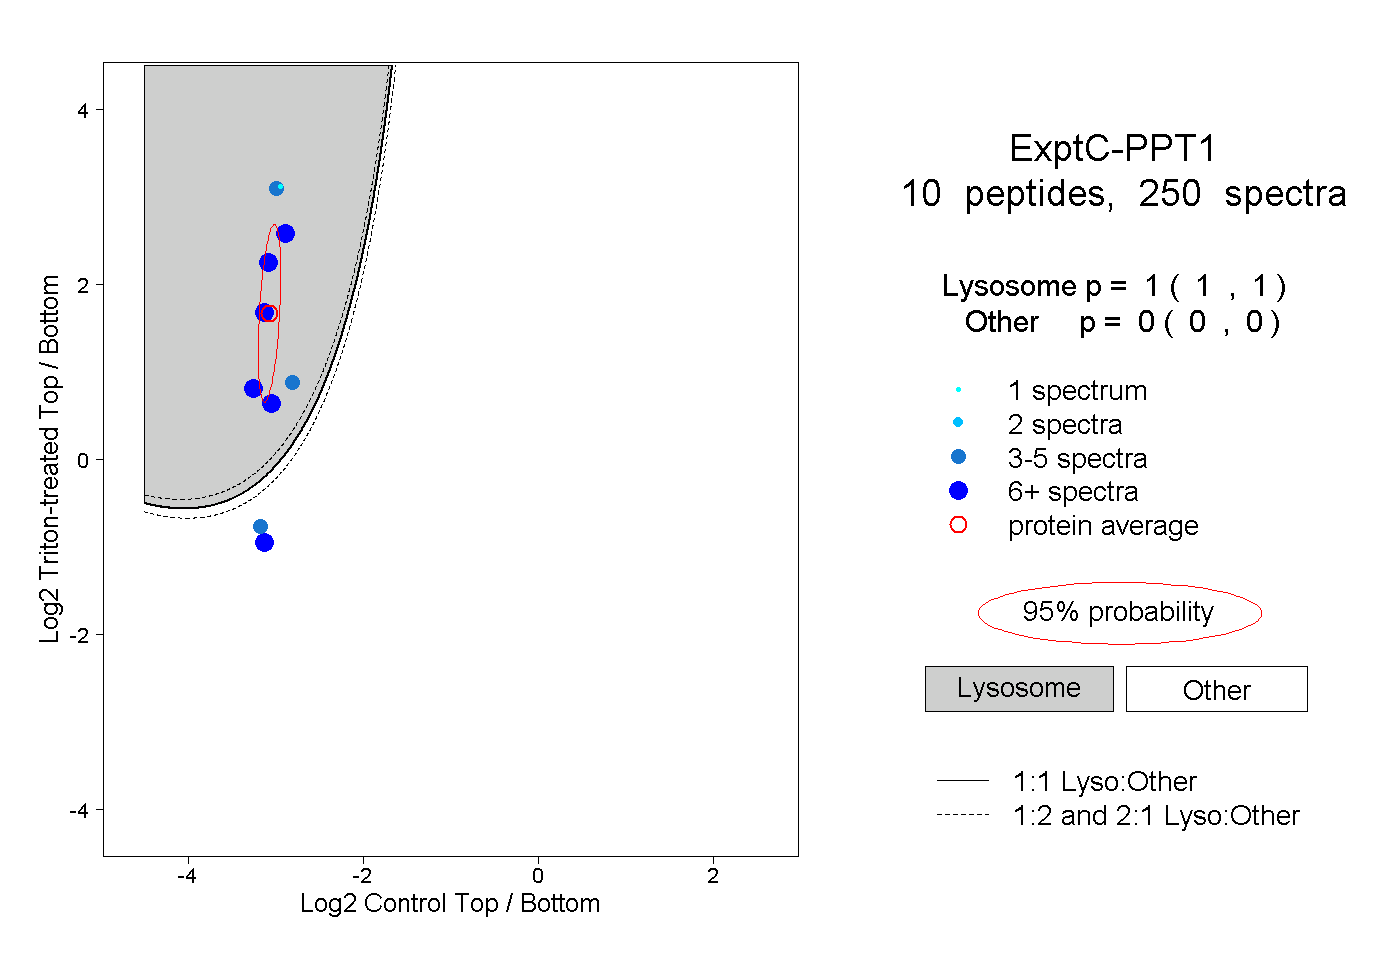
1.000 | 1.000
0.000 | 0.000
3peptides
spectra
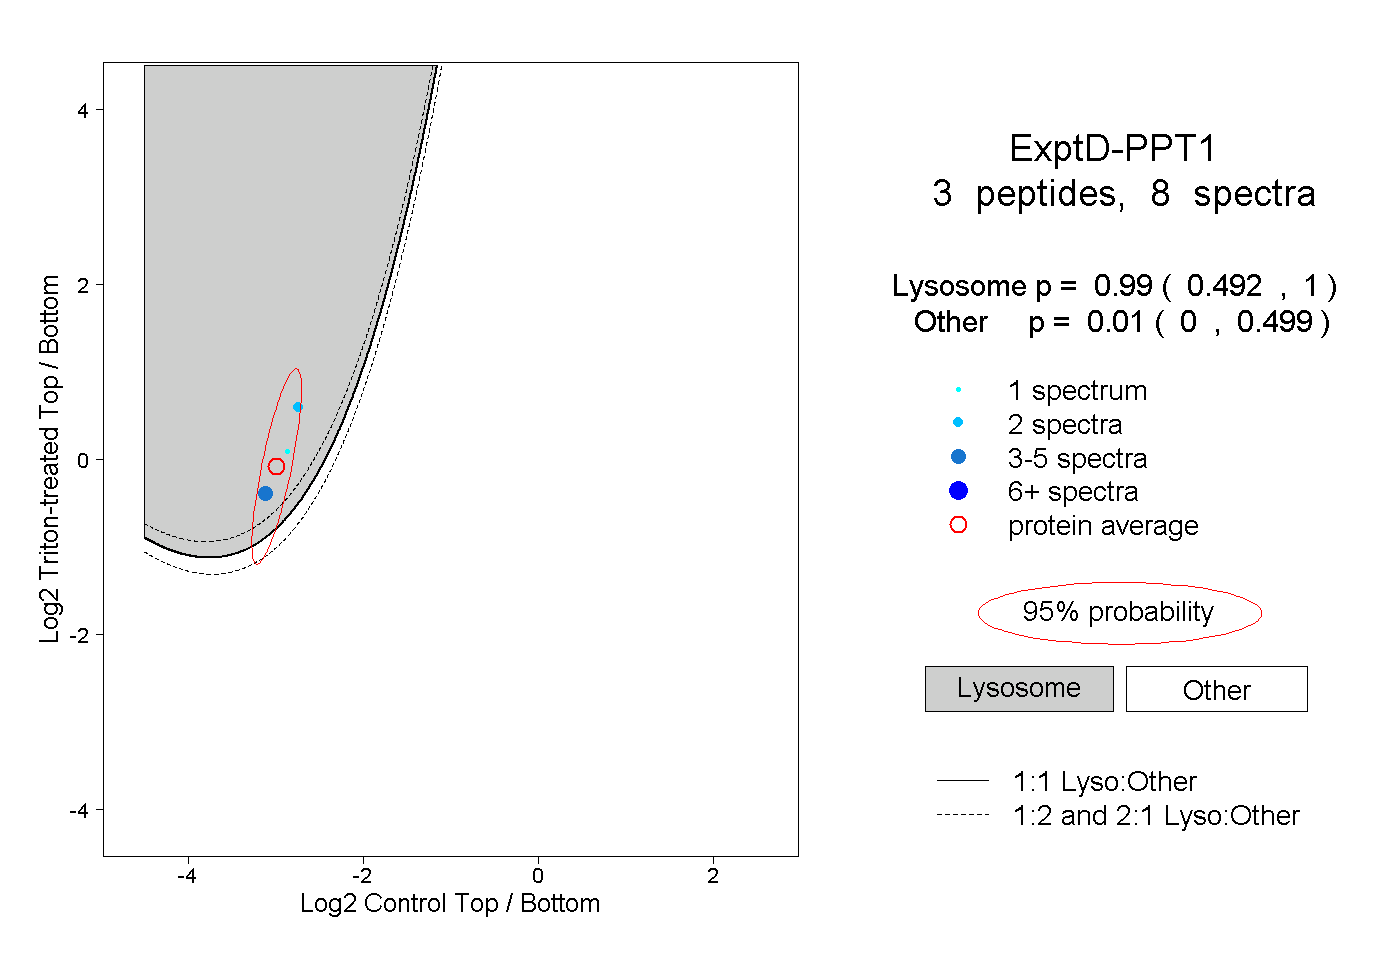
0.492 | 1.000
0.000 | 0.499