 8
8peptides
spectra
0.000 | 0.000
0.980 | 1.000
0.000 | 0.000
0.000 | 0.000
0.000 | 0.000
0.000 | 0.000
0.000 | 0.019
0.000 | 0.000
| Plot | Mito | Lyso | Perox | ER | Golgi | PM | Cytosol | Nucleus | |||||
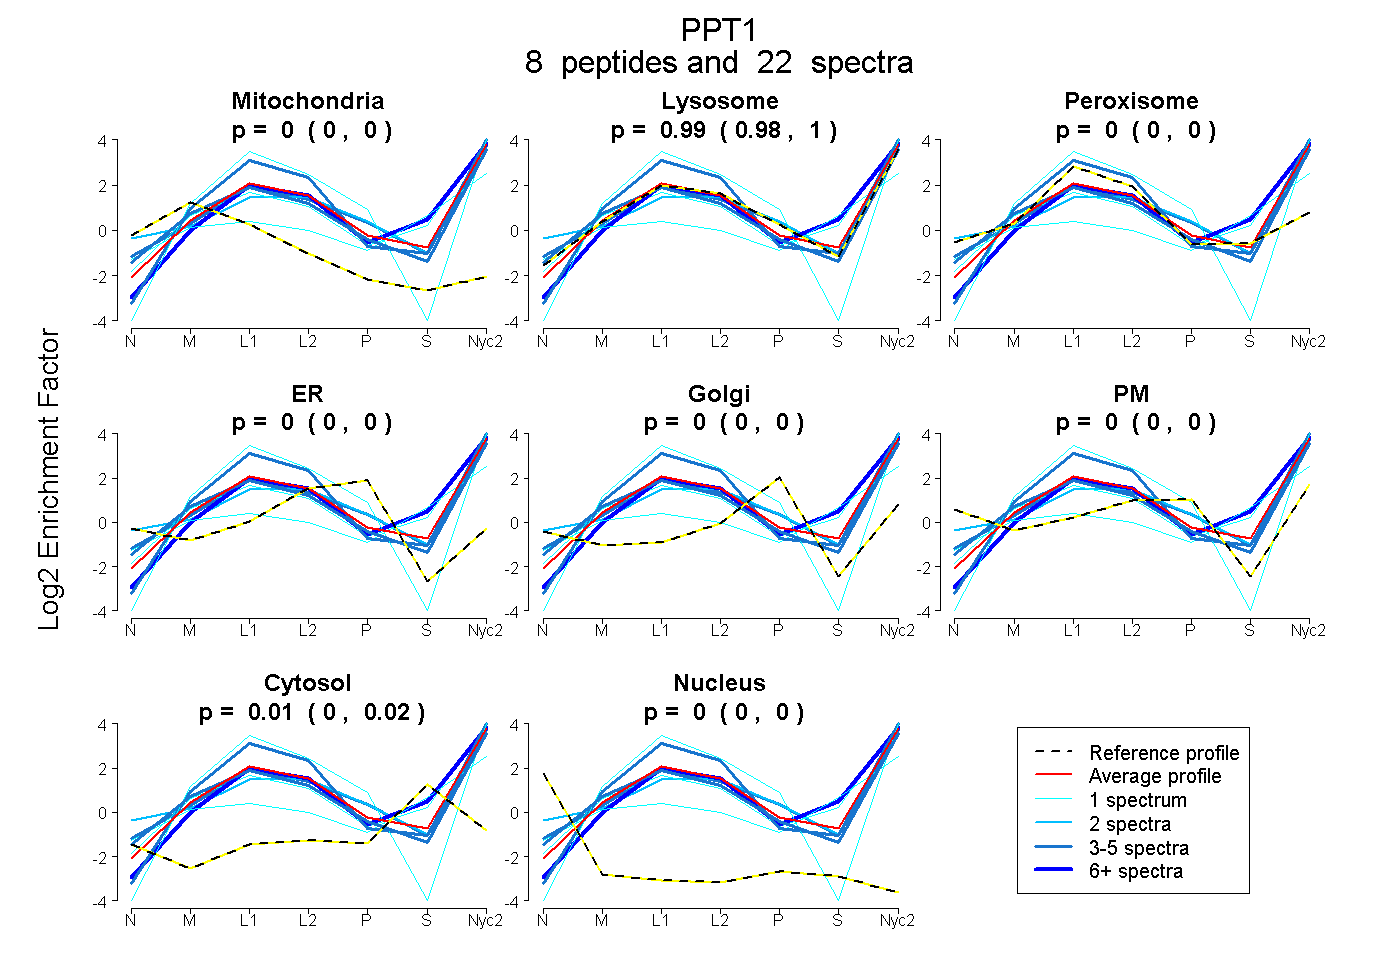
| Expt A |
8 peptides |
22 spectra |
|
0.000 0.000 | 0.000 |
0.991 0.980 | 1.000 |
0.000 0.000 | 0.000 |
0.000 0.000 | 0.000 |
0.000 0.000 | 0.000 |
0.000 0.000 | 0.000 |
0.009 0.000 | 0.019 |
0.000 0.000 | 0.000 |
| 6 spectra, ETIPLQETTLYTEDR | 0.000 | 0.904 | 0.000 | 0.000 | 0.000 | 0.000 | 0.096 | 0.000 | ||
| 1 spectrum, ENLMALK | 0.000 | 0.914 | 0.000 | 0.000 | 0.000 | 0.000 | 0.086 | 0.000 | ||
| 4 spectra, LVFLAK | 0.000 | 1.000 | 0.000 | 0.000 | 0.000 | 0.000 | 0.000 | 0.000 | ||
| 2 spectra, EIPGIYVLSLEIGK | 0.000 | 0.808 | 0.000 | 0.000 | 0.000 | 0.192 | 0.000 | 0.000 | ||
| 4 spectra, CPGESSHICDFIR | 0.000 | 0.953 | 0.000 | 0.000 | 0.000 | 0.047 | 0.000 | 0.000 | ||
| 3 spectra, SLNAGAYSK | 0.069 | 0.931 | 0.000 | 0.000 | 0.000 | 0.000 | 0.000 | 0.000 | ||
| 1 spectrum, LVQAQYWHDPIK | 0.000 | 1.000 | 0.000 | 0.000 | 0.000 | 0.000 | 0.000 | 0.000 | ||
| 1 spectrum, LQHGYNAIGFSQGGQFLR | 0.000 | 0.614 | 0.000 | 0.000 | 0.000 | 0.000 | 0.386 | 0.000 |
| Plot | Mito | Lyso or Perox | ER | Golgi | PM | Cytosol | Nucleus | ||||||
| Expt B |
7 peptides |
20 spectra |
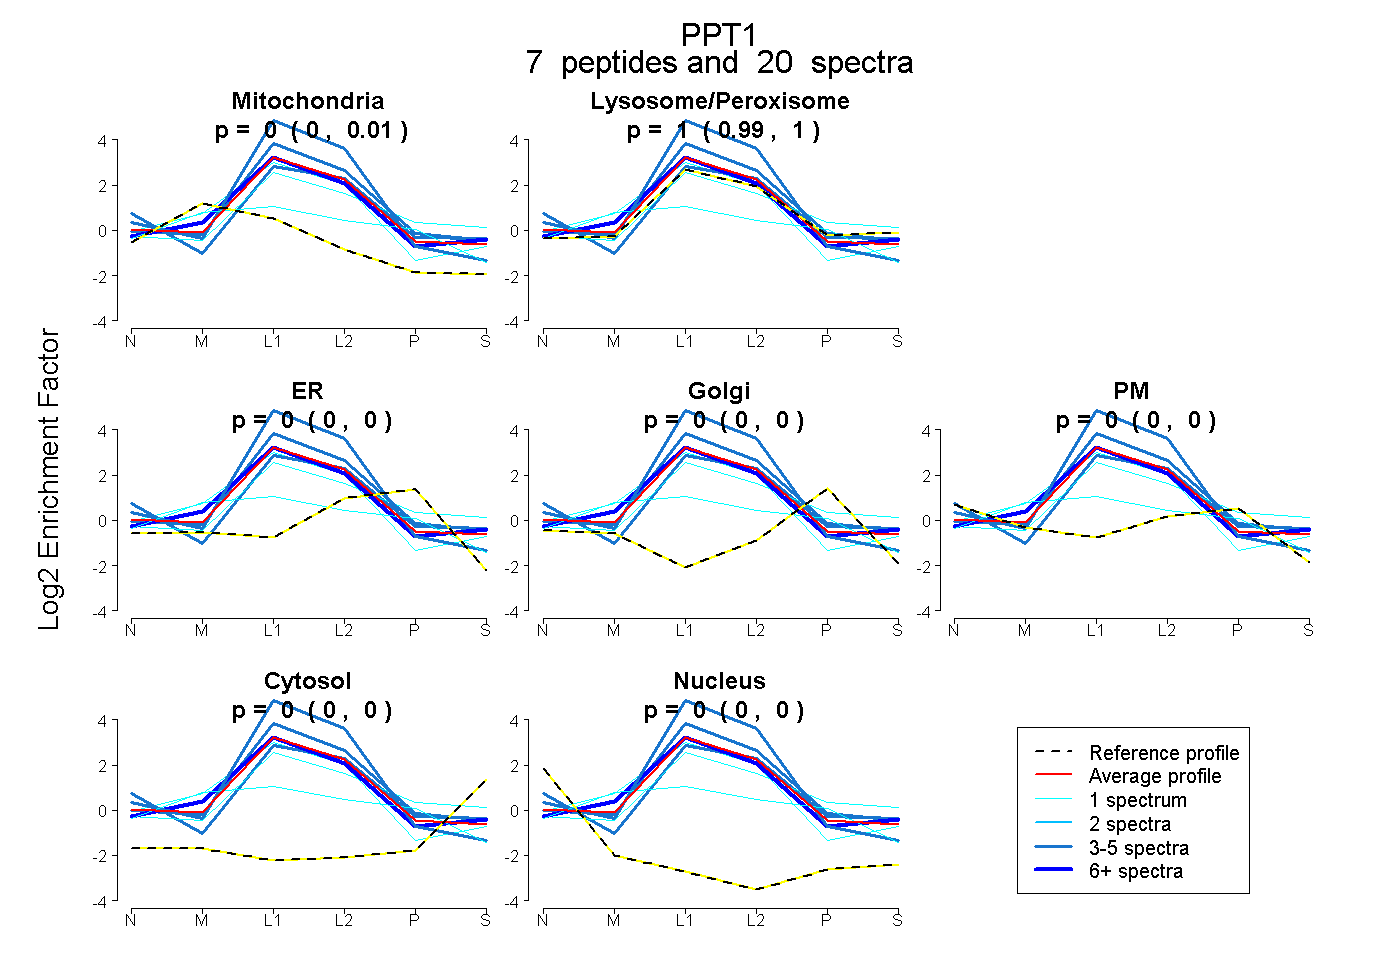 |
0.000 0.000 | 0.007 |
1.000 0.989 | 1.000 |
0.000 0.000 | 0.000 |
0.000 0.000 | 0.000 |
0.000 0.000 | 0.000 |
0.000 0.000 | 0.000 |
0.000 0.000 | 0.000 |
|||
| Plot | Lyso | Other | |||||||||||
| Expt C |
10 peptides |
250 spectra |
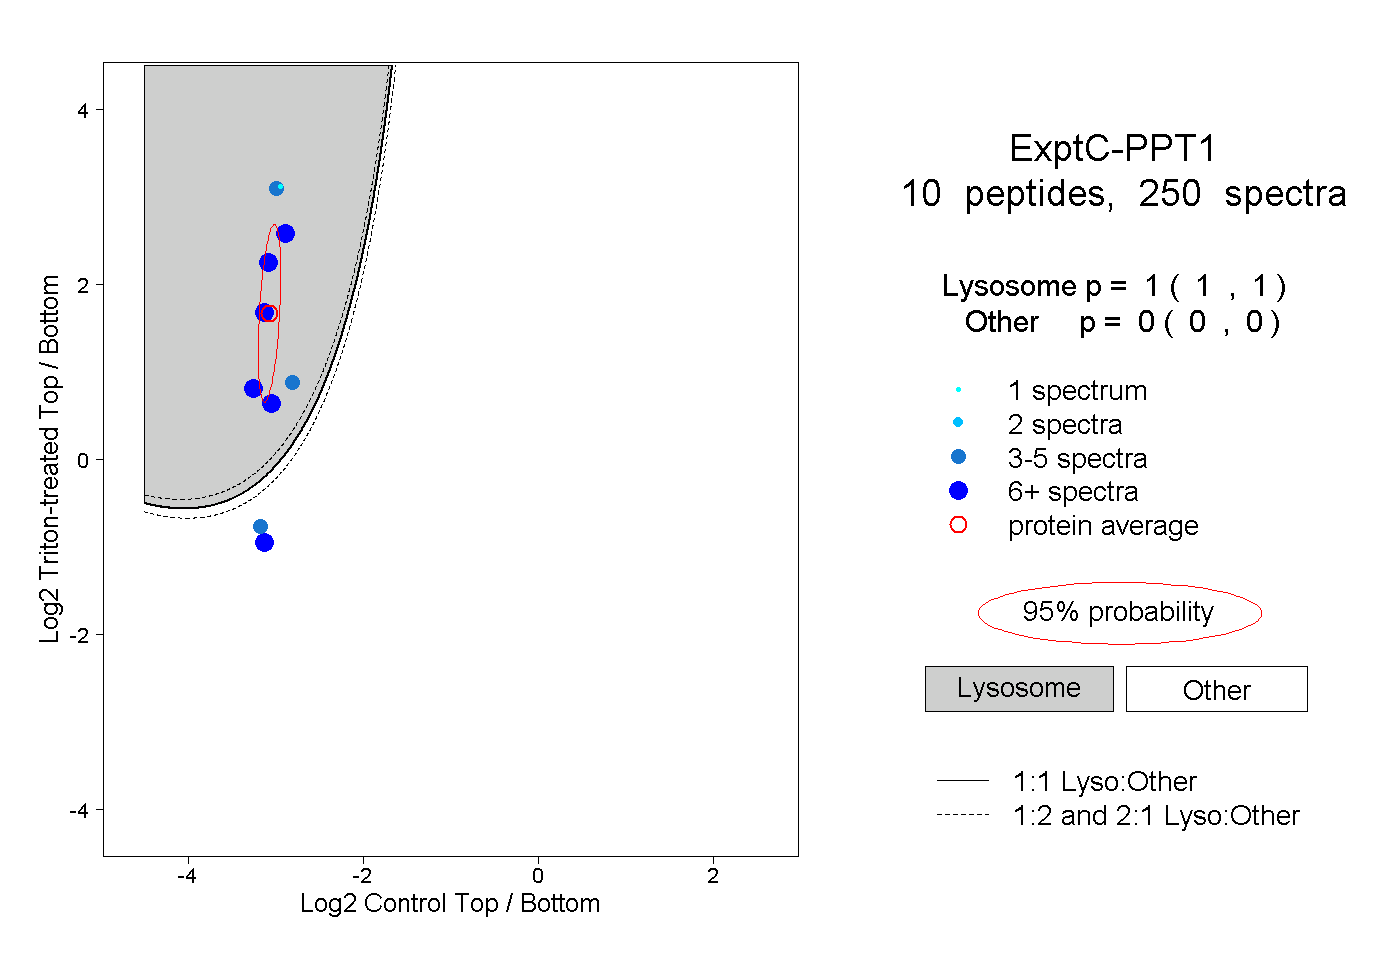 |
1.000 1.000 | 1.000 |
0.000 0.000 | 0.000 |
||||||||
| Plot | Lyso | Other | |||||||||||
| Expt D |
3 peptides |
8 spectra |
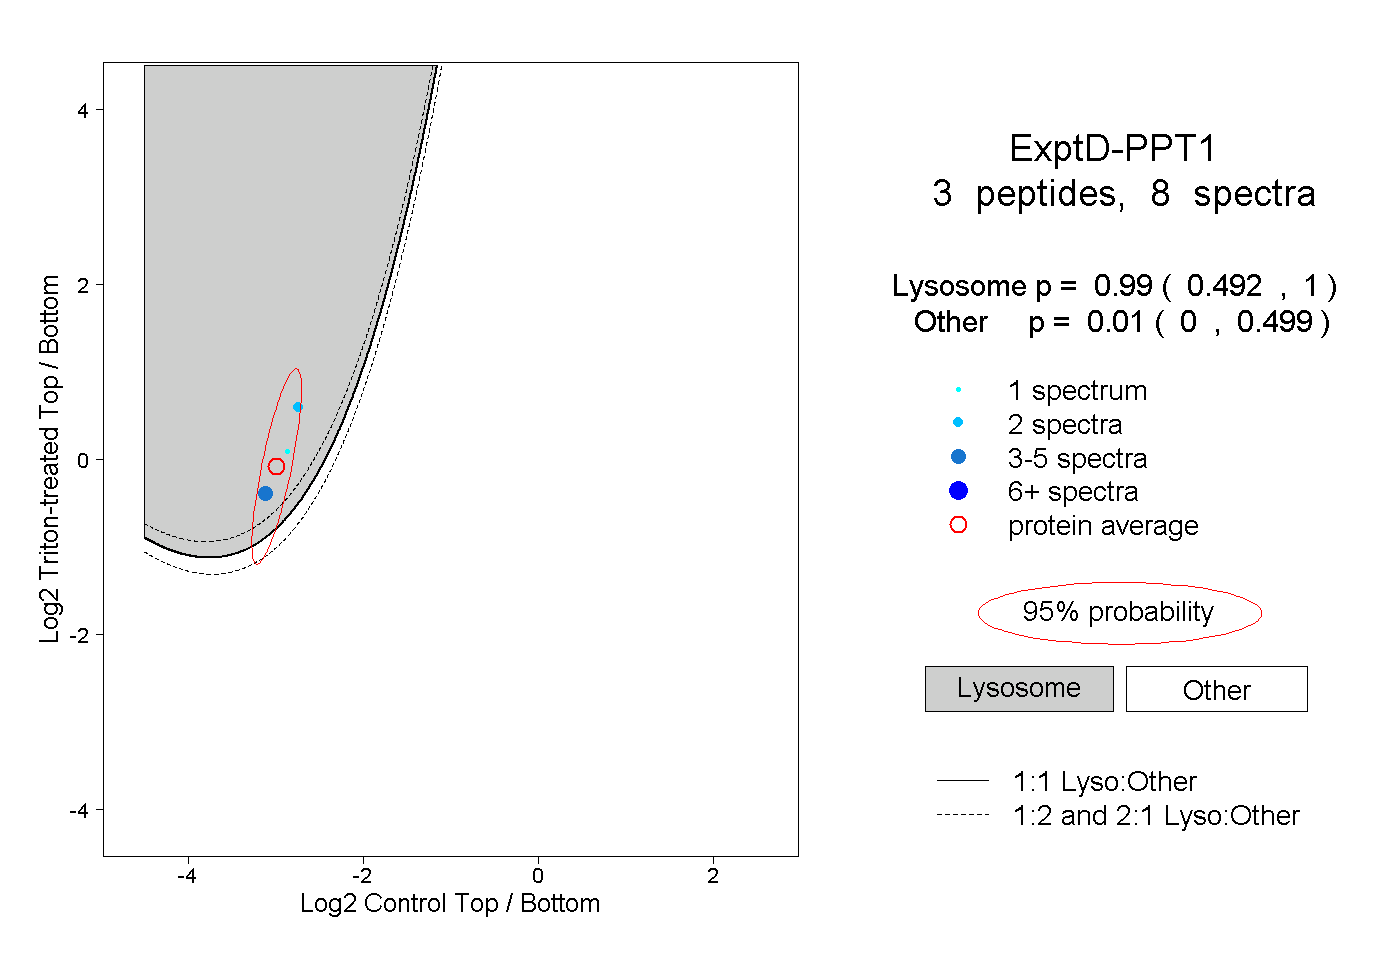 |
0.990 0.492 | 1.000 |
0.010 0.000 | 0.499 |