 7
7peptides
spectra
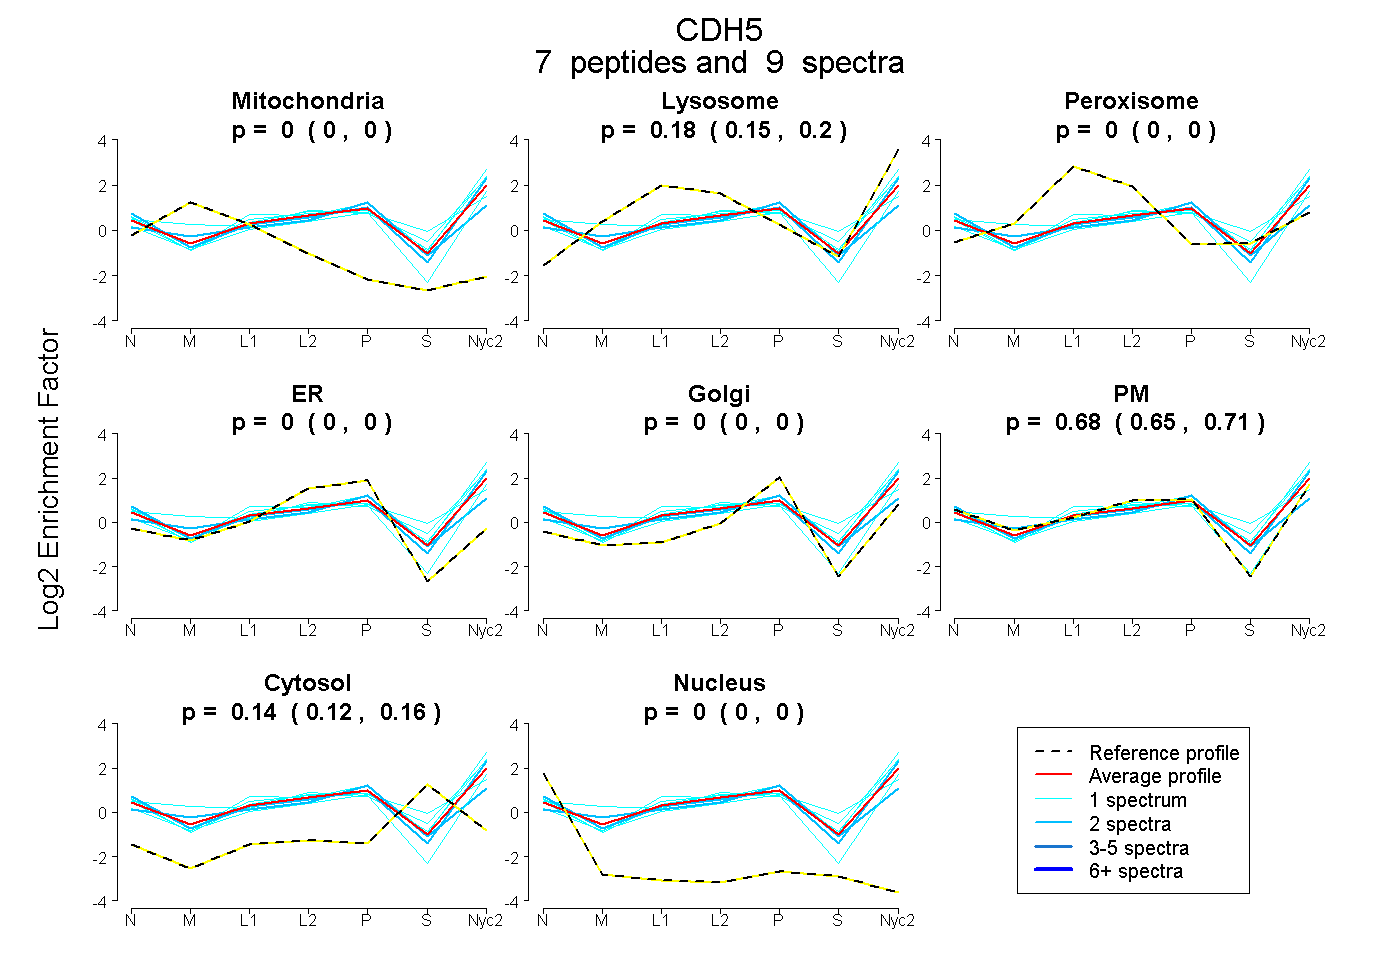
0.000 | 0.000
0.147 | 0.198
0.000 | 0.000
0.000 | 0.000
0.000 | 0.000
0.650 | 0.711
0.121 | 0.156
0.000 | 0.000
11peptides
spectra
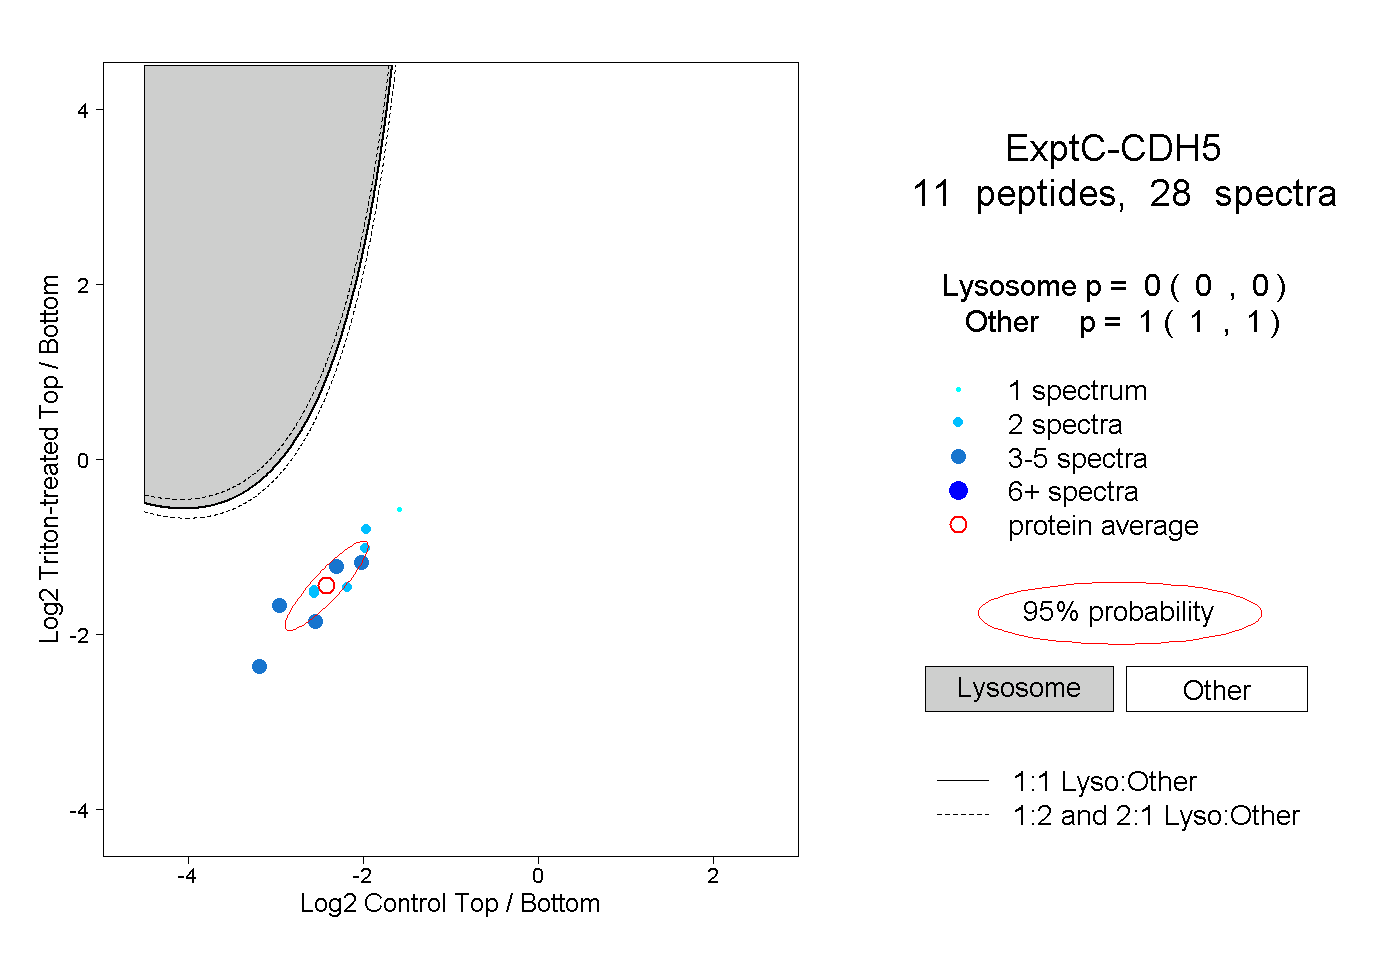
0.000 | 0.000
1.000 | 1.000
2peptides
spectra
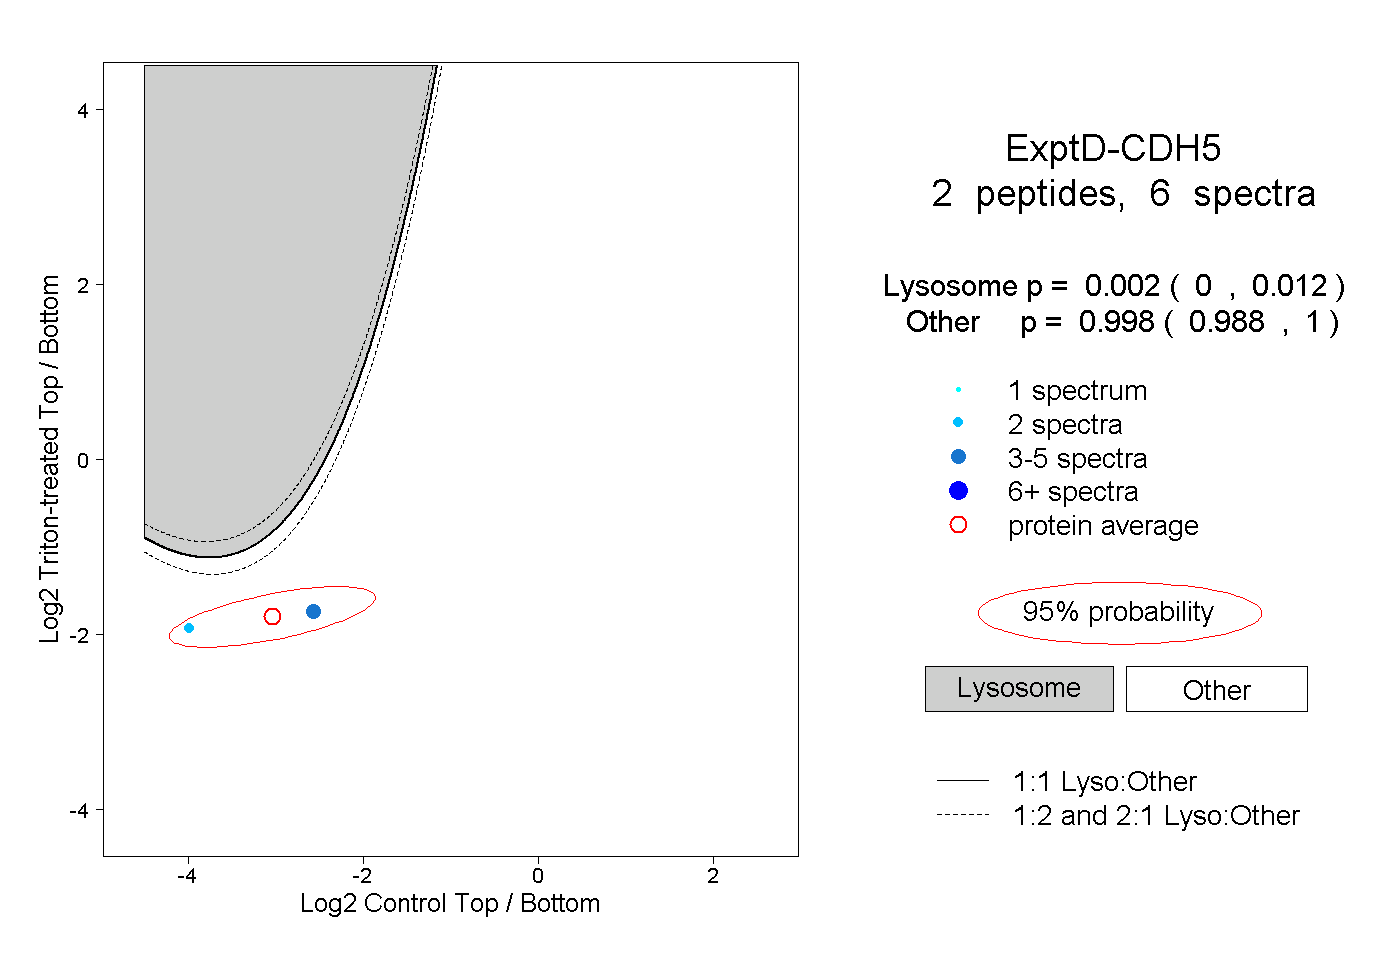
0.000 | 0.012
0.988 | 1.000