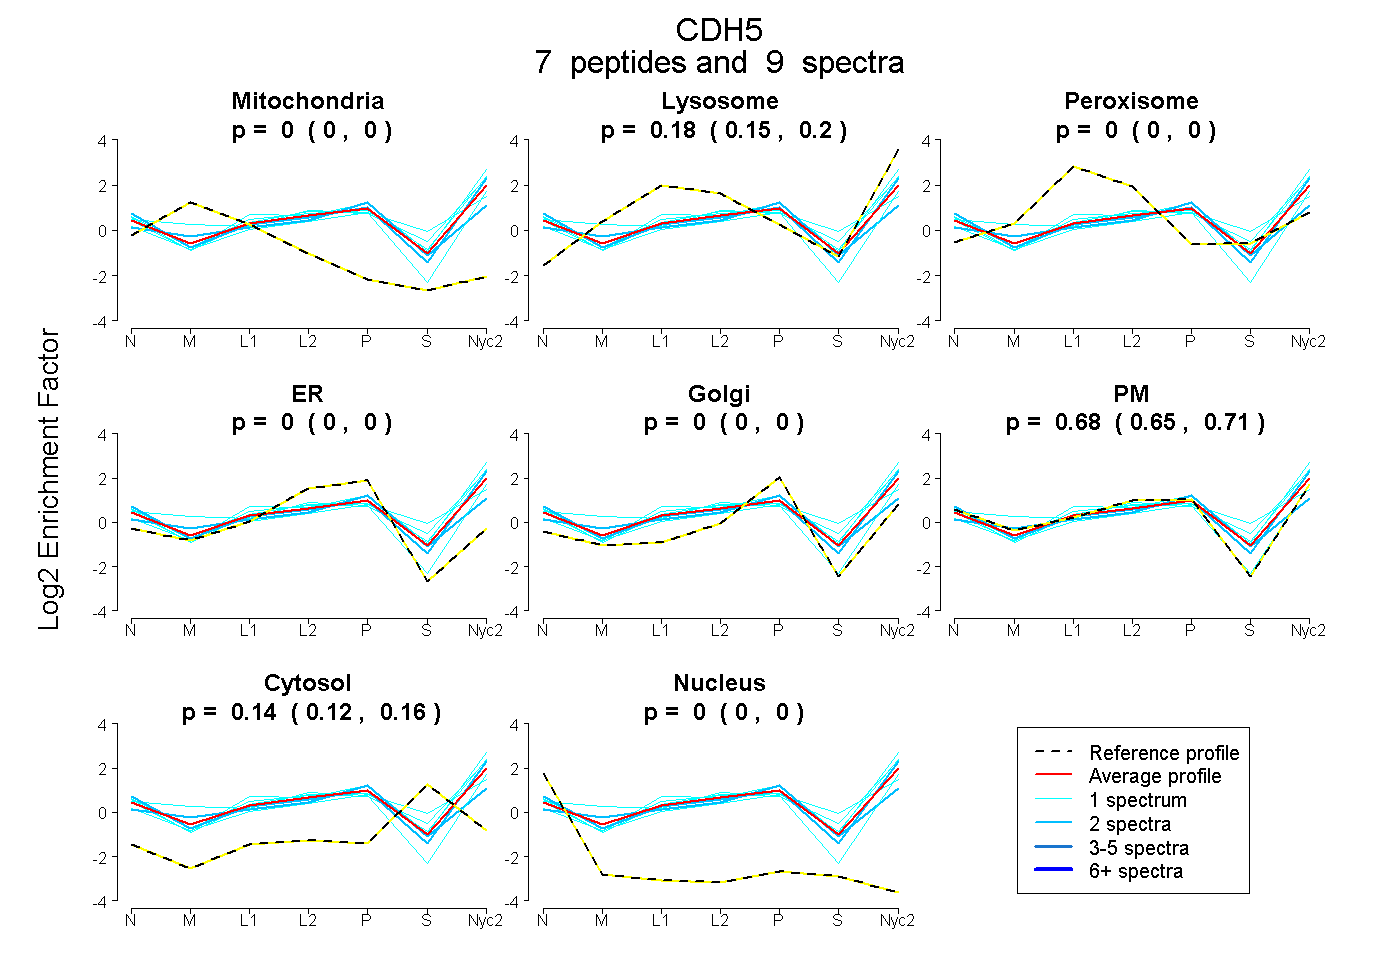
 7
7peptides
spectra
0.000 | 0.000
0.147 | 0.198
0.000 | 0.000
0.000 | 0.000
0.000 | 0.000
0.650 | 0.711
0.121 | 0.156
0.000 | 0.000
| Plot | Mito | Lyso | Perox | ER | Golgi | PM | Cytosol | Nucleus | |||||
| Expt A |
7 peptides |
9 spectra |
|
0.000 0.000 | 0.000 |
0.176 0.147 | 0.198 |
0.000 0.000 | 0.000 |
0.000 0.000 | 0.000 |
0.000 0.000 | 0.000 |
0.683 0.650 | 0.711 |
0.140 0.121 | 0.156 |
0.000 0.000 | 0.000 |
| 1 spectrum, IIINVLDVDEPPVFQR | 0.000 | 0.239 | 0.000 | 0.000 | 0.000 | 0.633 | 0.128 | 0.000 | ||
| 1 spectrum, EMATMIEVK | 0.000 | 0.190 | 0.000 | 0.000 | 0.000 | 0.495 | 0.315 | 0.000 | ||
| 2 spectra, LAPSLHGGPR | 0.000 | 0.023 | 0.184 | 0.000 | 0.331 | 0.362 | 0.101 | 0.000 | ||
| 1 spectrum, DTFTIETDPDR | 0.000 | 0.261 | 0.000 | 0.000 | 0.000 | 0.559 | 0.180 | 0.000 | ||
| 1 spectrum, FYHFHLPENK | 0.000 | 0.297 | 0.000 | 0.000 | 0.000 | 0.612 | 0.091 | 0.000 | ||
| 1 spectrum, QAHAHSK | 0.074 | 0.087 | 0.000 | 0.000 | 0.000 | 0.839 | 0.000 | 0.000 | ||
| 2 spectra, SIGYSIR | 0.000 | 0.119 | 0.000 | 0.000 | 0.000 | 0.793 | 0.088 | 0.000 |
| Plot | Lyso | Other | |||||||||||
| Expt C |
11 peptides |
28 spectra |
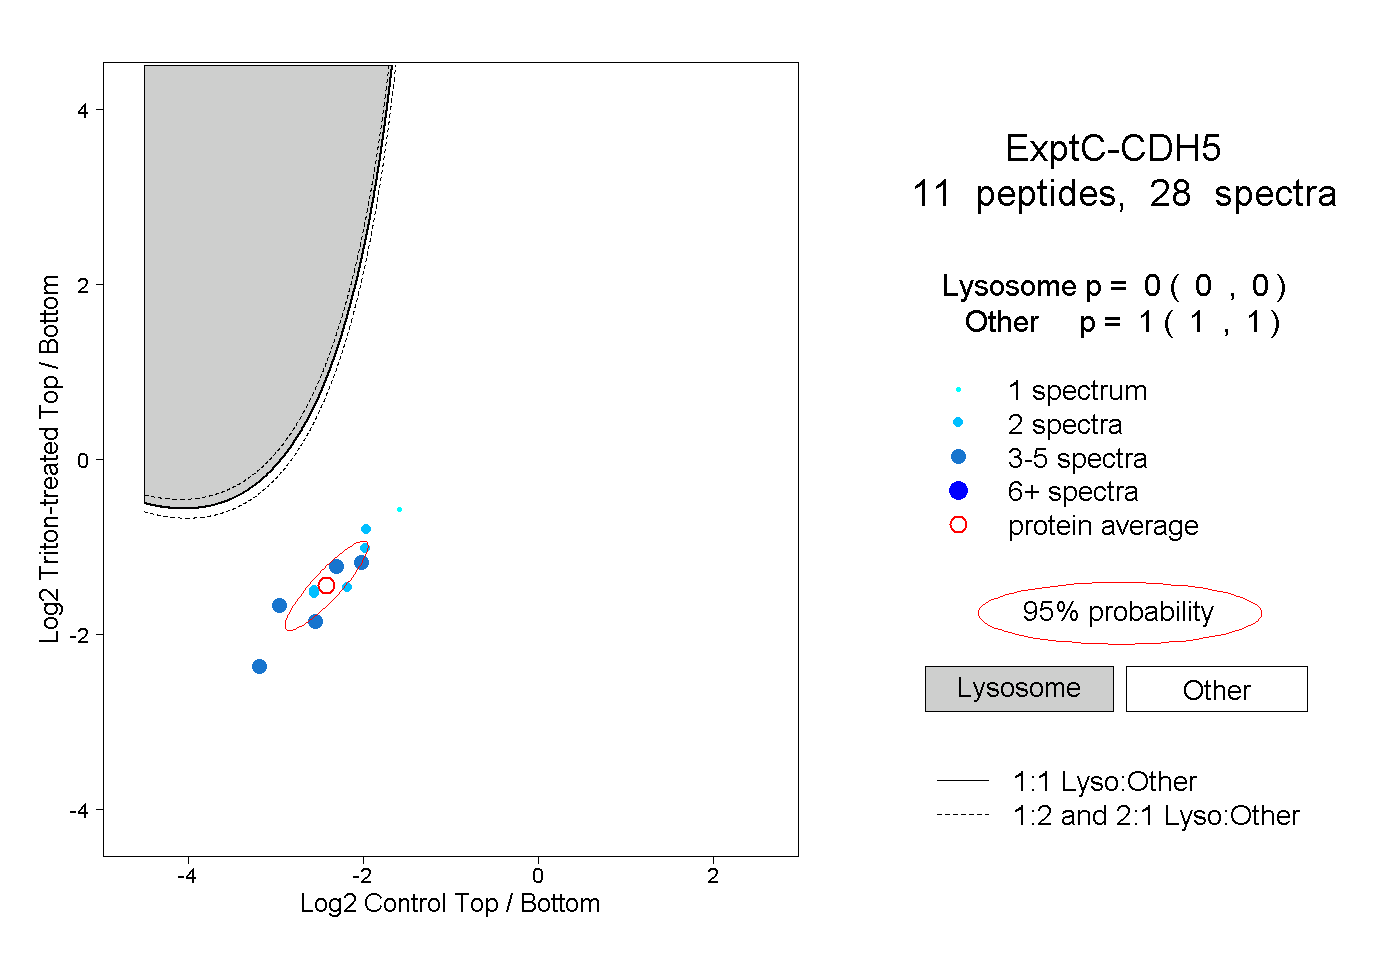 |
0.000 0.000 | 0.000 |
1.000 1.000 | 1.000 |
||||||||
| Plot | Lyso | Other | |||||||||||
| Expt D |
2 peptides |
6 spectra |
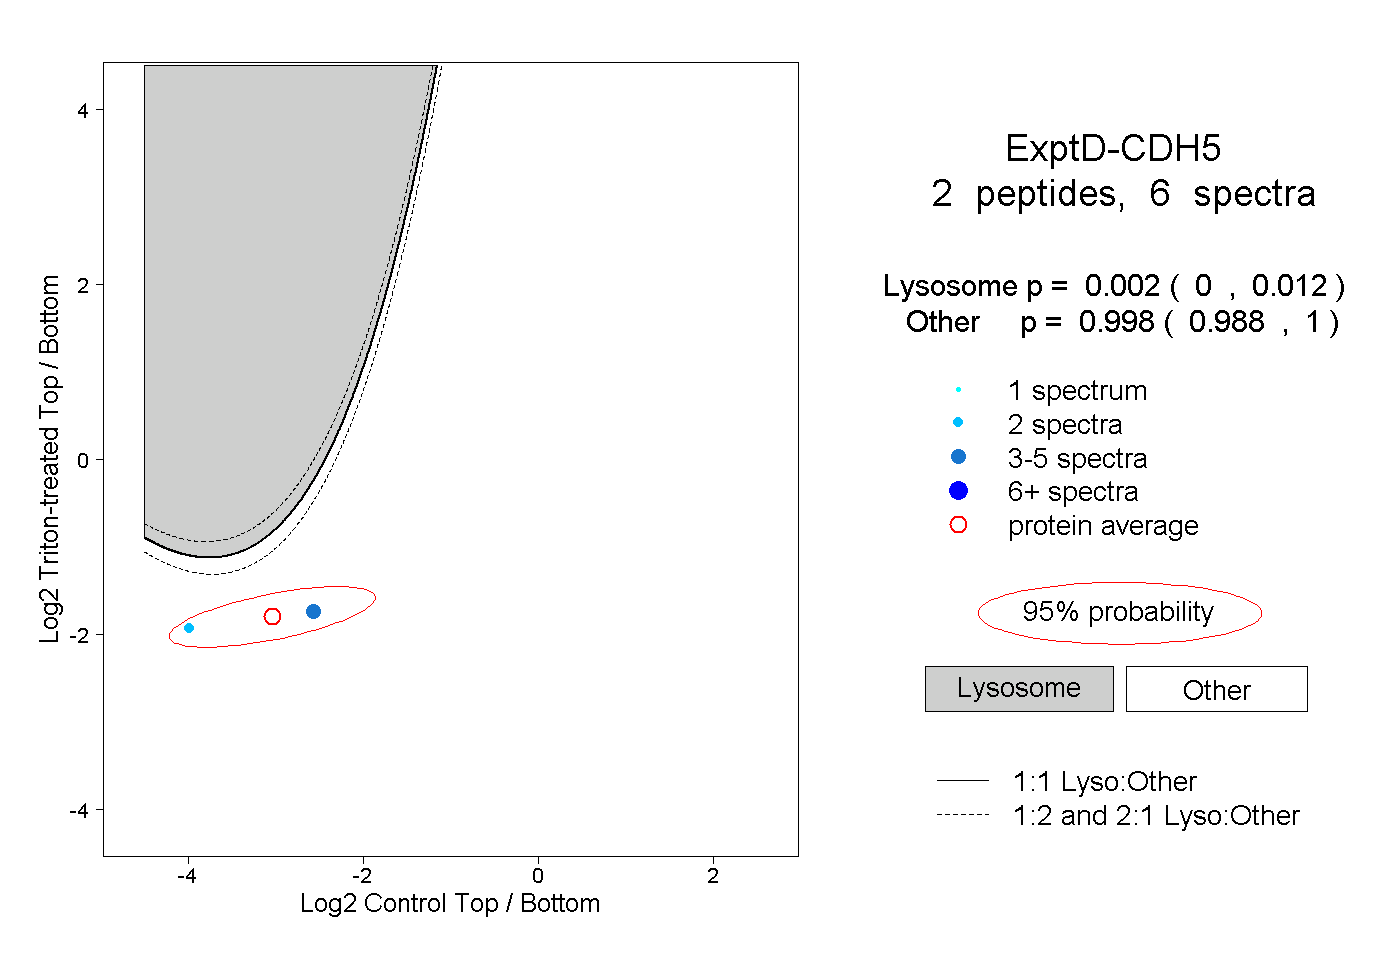 |
0.002 0.000 | 0.012 |
0.998 0.988 | 1.000 |