 8
8peptides
spectra
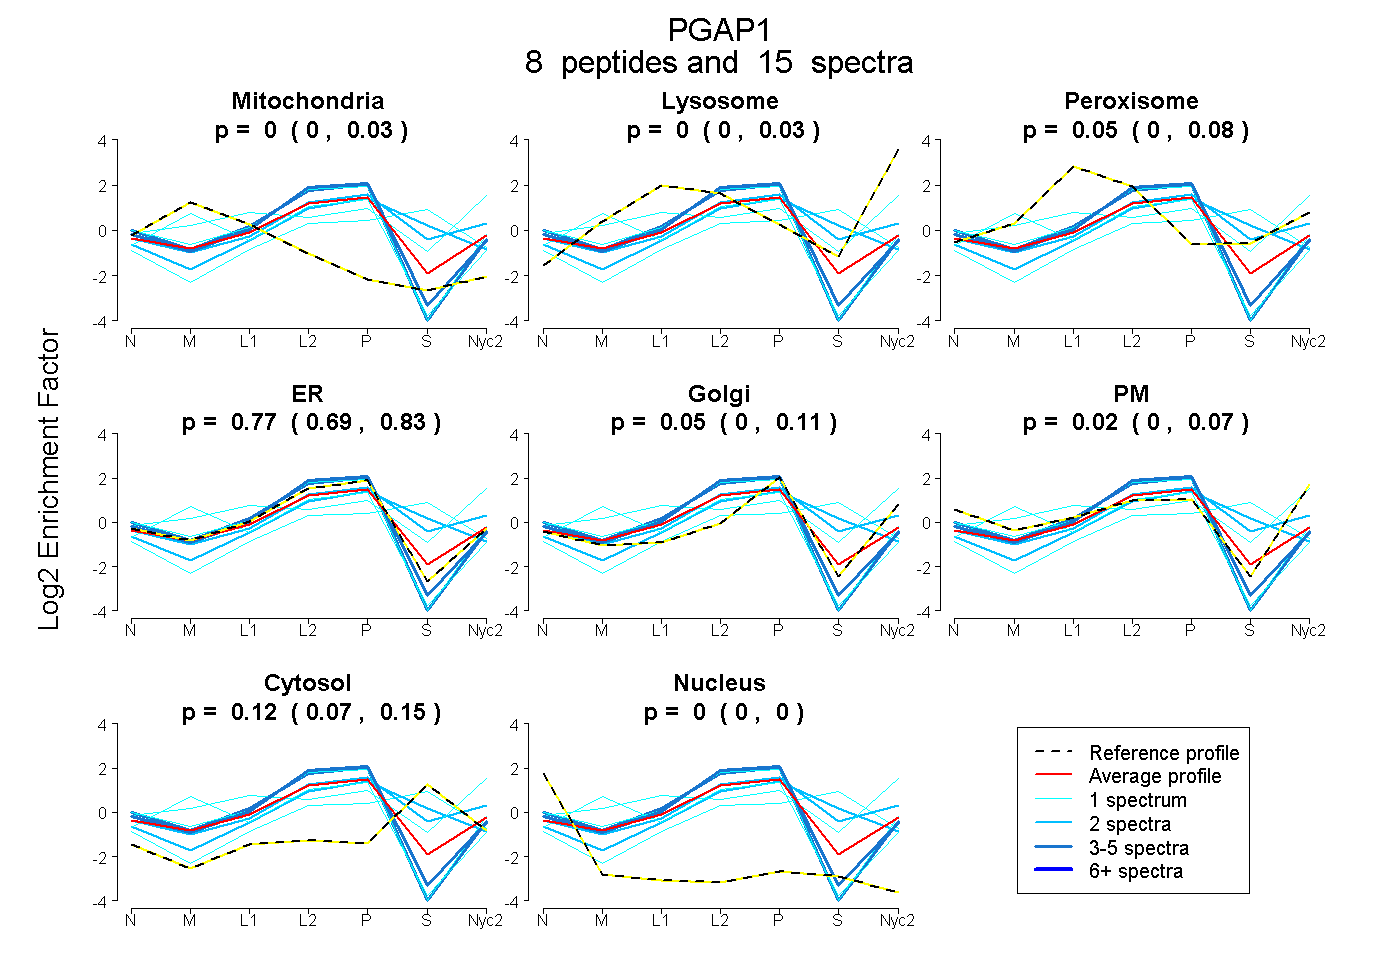
0.000 | 0.032
0.000 | 0.030
0.000 | 0.080
0.691 | 0.831
0.000 | 0.107
0.000 | 0.071
0.067 | 0.153
0.000 | 0.000
2peptides
spectra
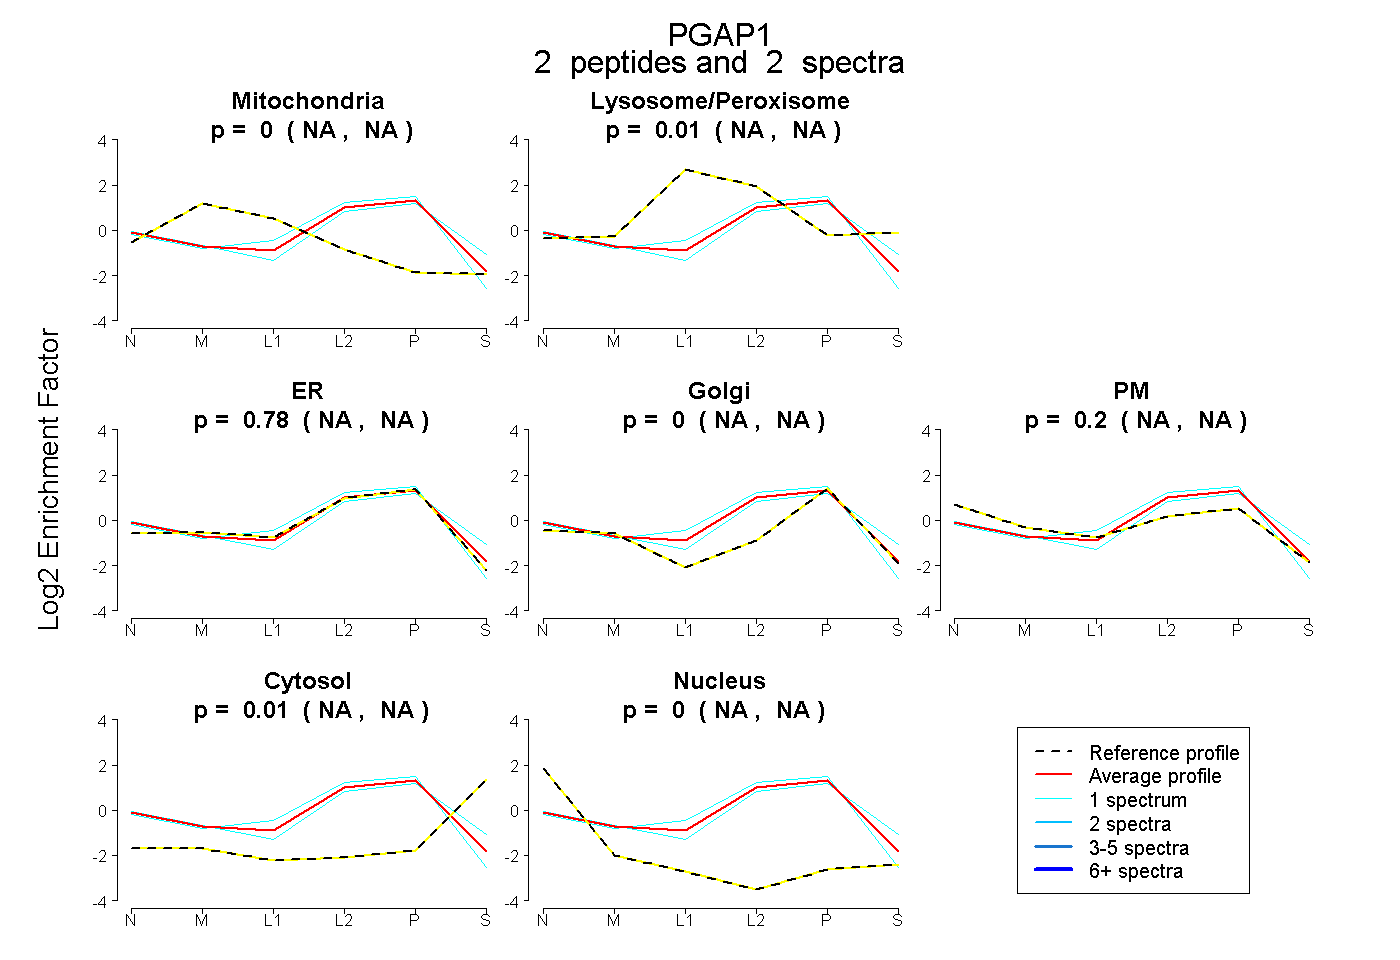
NA | NA
NA | NA
NA | NA
NA | NA
NA | NA
NA | NA
NA | NA
6peptides
spectra
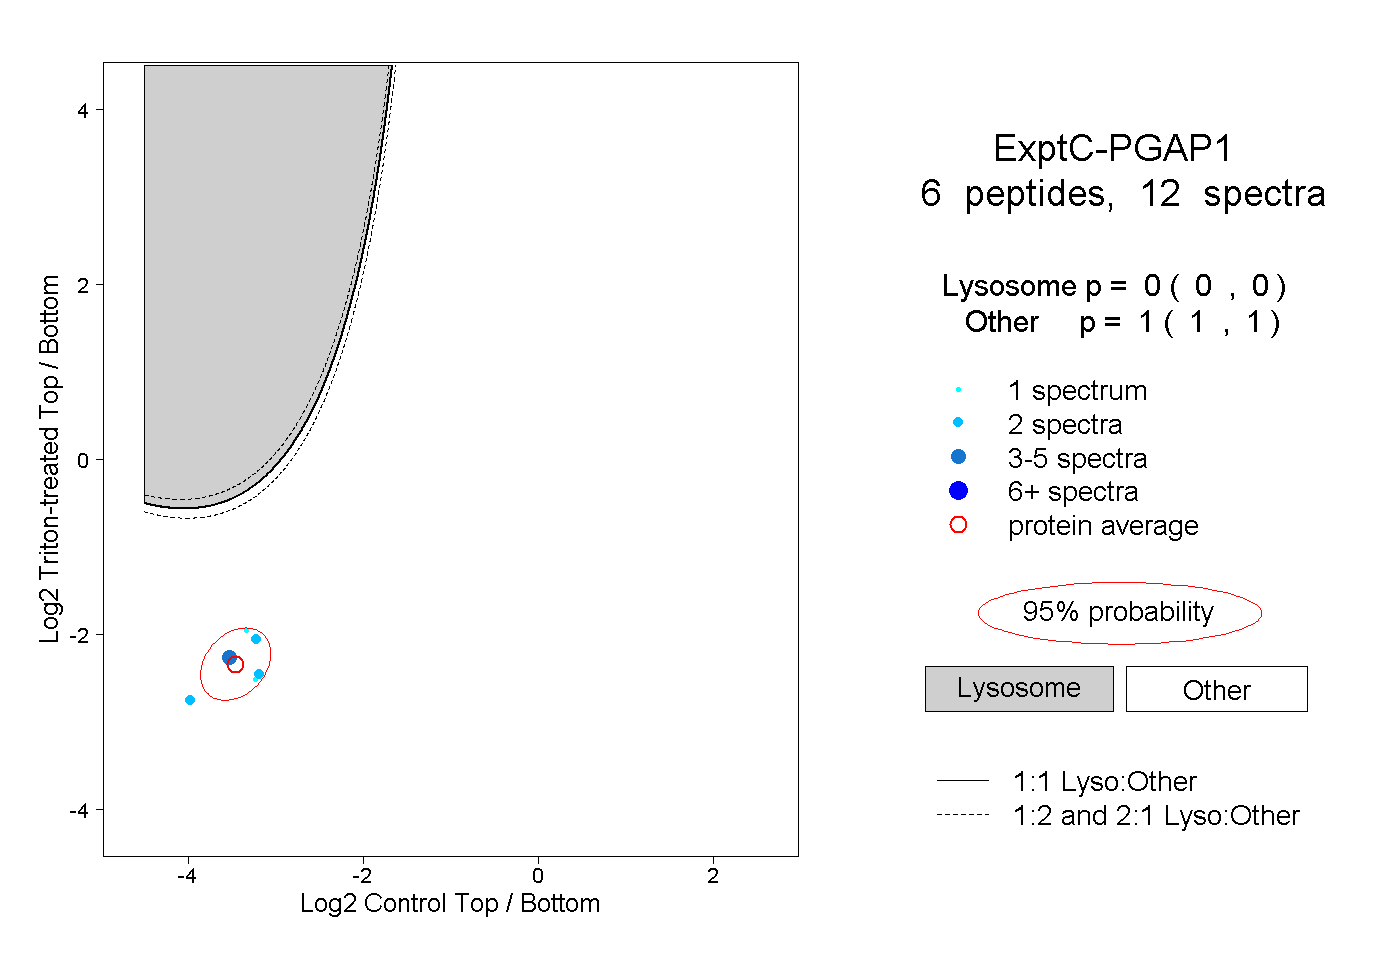
0.000 | 0.000
1.000 | 1.000