 8
8peptides
spectra
0.000 | 0.032
0.000 | 0.030
0.000 | 0.080
0.691 | 0.831
0.000 | 0.107
0.000 | 0.071
0.067 | 0.153
0.000 | 0.000
2peptides
spectra
NA | NA
NA | NA
NA | NA
NA | NA
NA | NA
NA | NA
NA | NA
| Plot | Mito | Lyso | Perox | ER | Golgi | PM | Cytosol | Nucleus | |||||
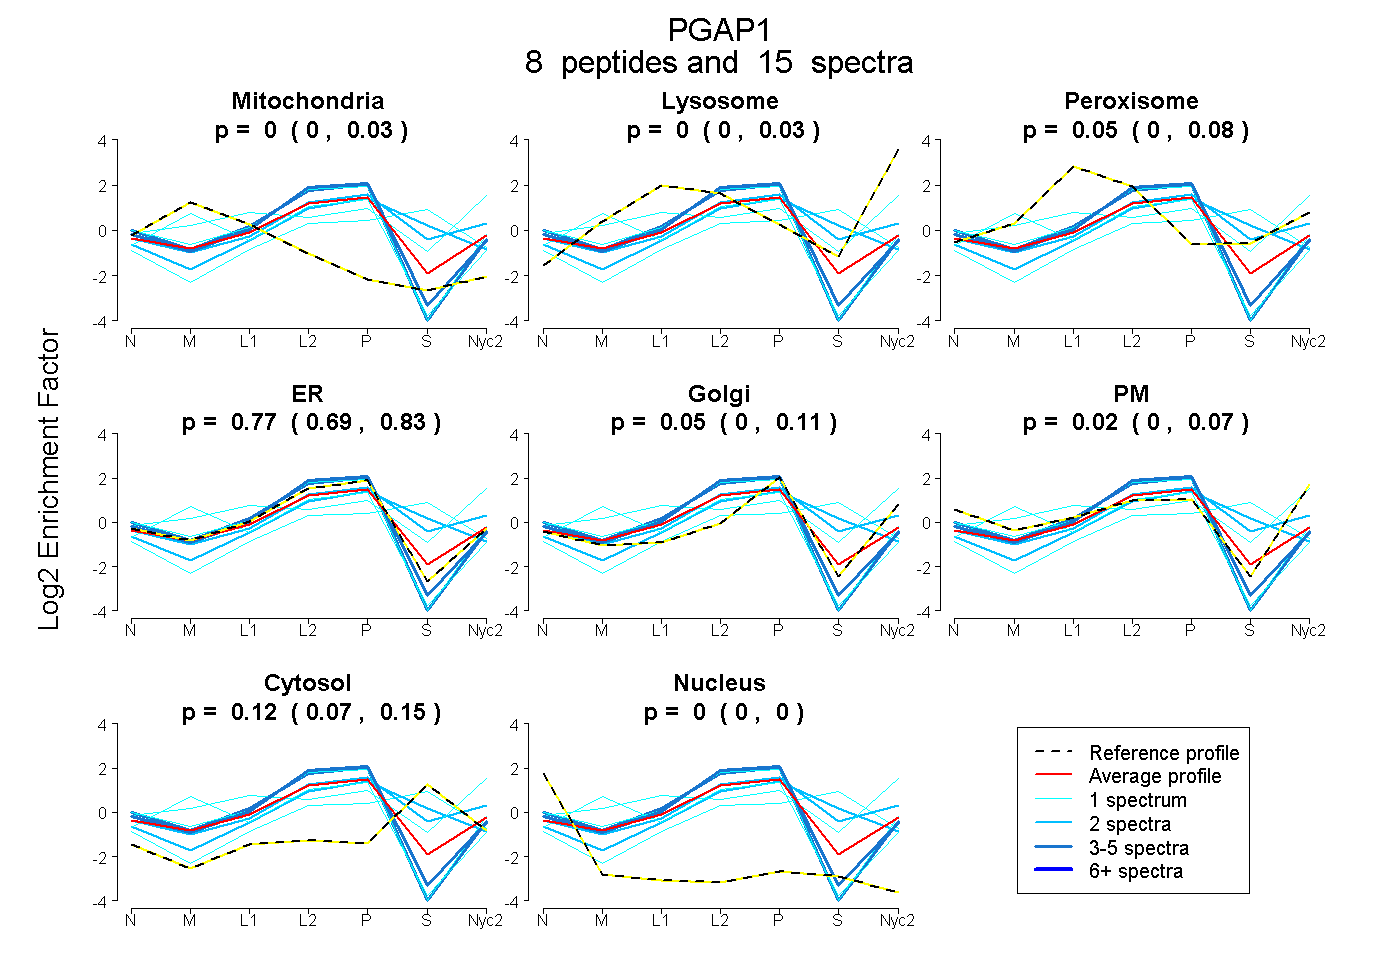
| Expt A |
8 peptides |
15 spectra |
|
0.000 0.000 | 0.032 |
0.000 0.000 | 0.030 |
0.049 0.000 | 0.080 |
0.769 0.691 | 0.831 |
0.045 0.000 | 0.107 |
0.018 0.000 | 0.071 |
0.119 0.067 | 0.153 |
0.000 0.000 | 0.000 |
||
| Plot | Mito | Lyso or Perox | ER | Golgi | PM | Cytosol | Nucleus | ||||||
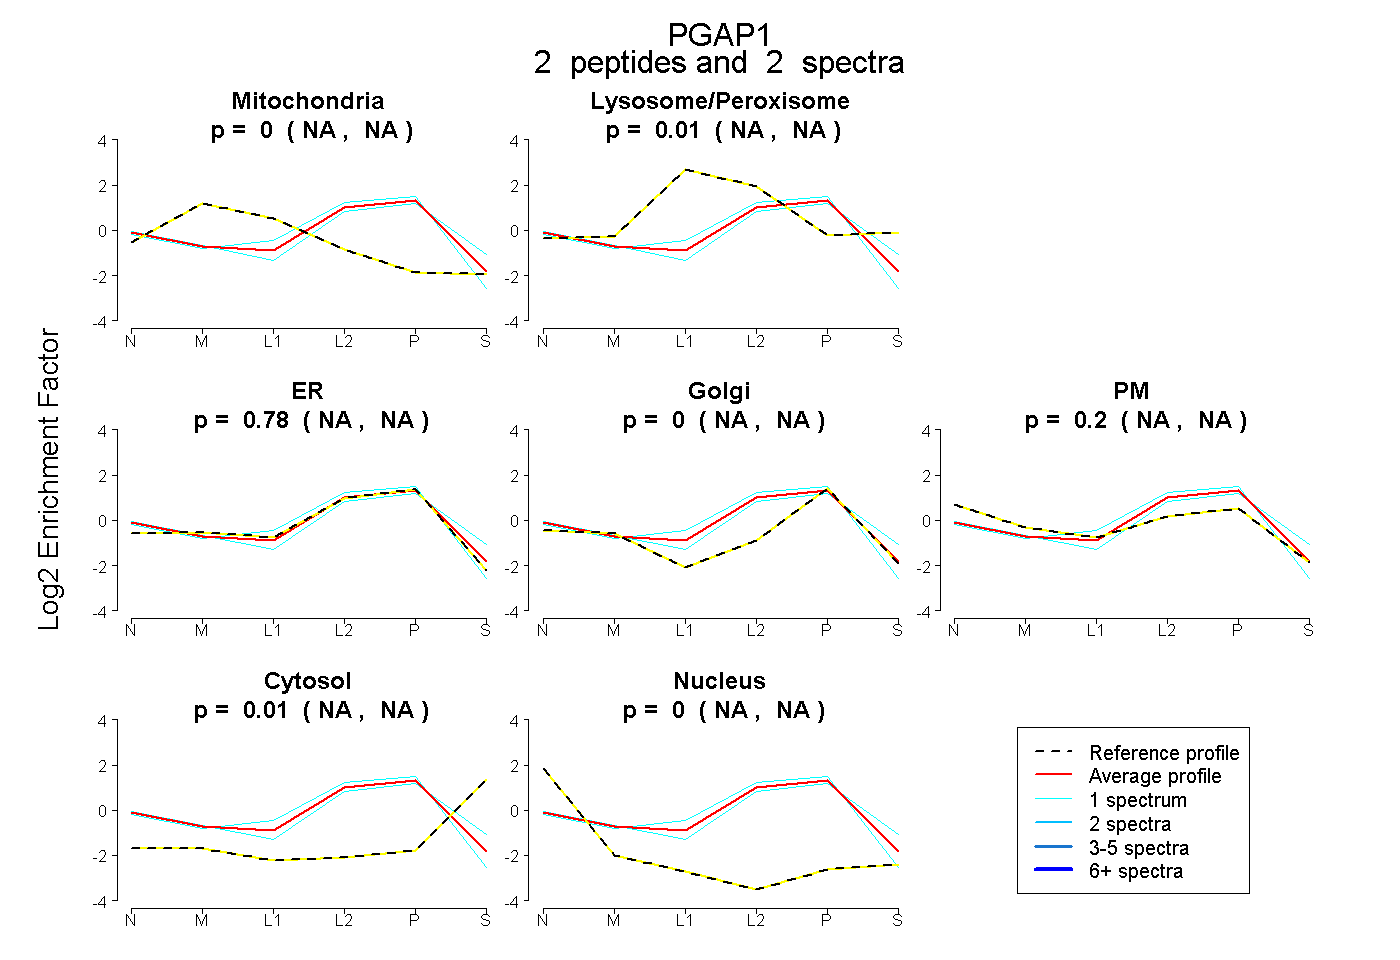
| Expt B |
2 peptides |
2 spectra |
|
0.000 NA | NA |
0.011 NA | NA |
0.781 NA | NA |
0.000 NA | NA |
0.199 NA | NA |
0.009 NA | NA |
0.000 NA | NA |
| 1 spectrum, AFFDLIDADTK | 0.000 | 0.019 | 0.975 | 0.000 | 0.006 | 0.000 | 0.000 | |||
| 1 spectrum, LSANDAEDSLR | 0.000 | 0.000 | 0.637 | 0.000 | 0.242 | 0.120 | 0.000 |
| Plot | Lyso | Other | |||||||||||
| Expt C |
6 peptides |
12 spectra |
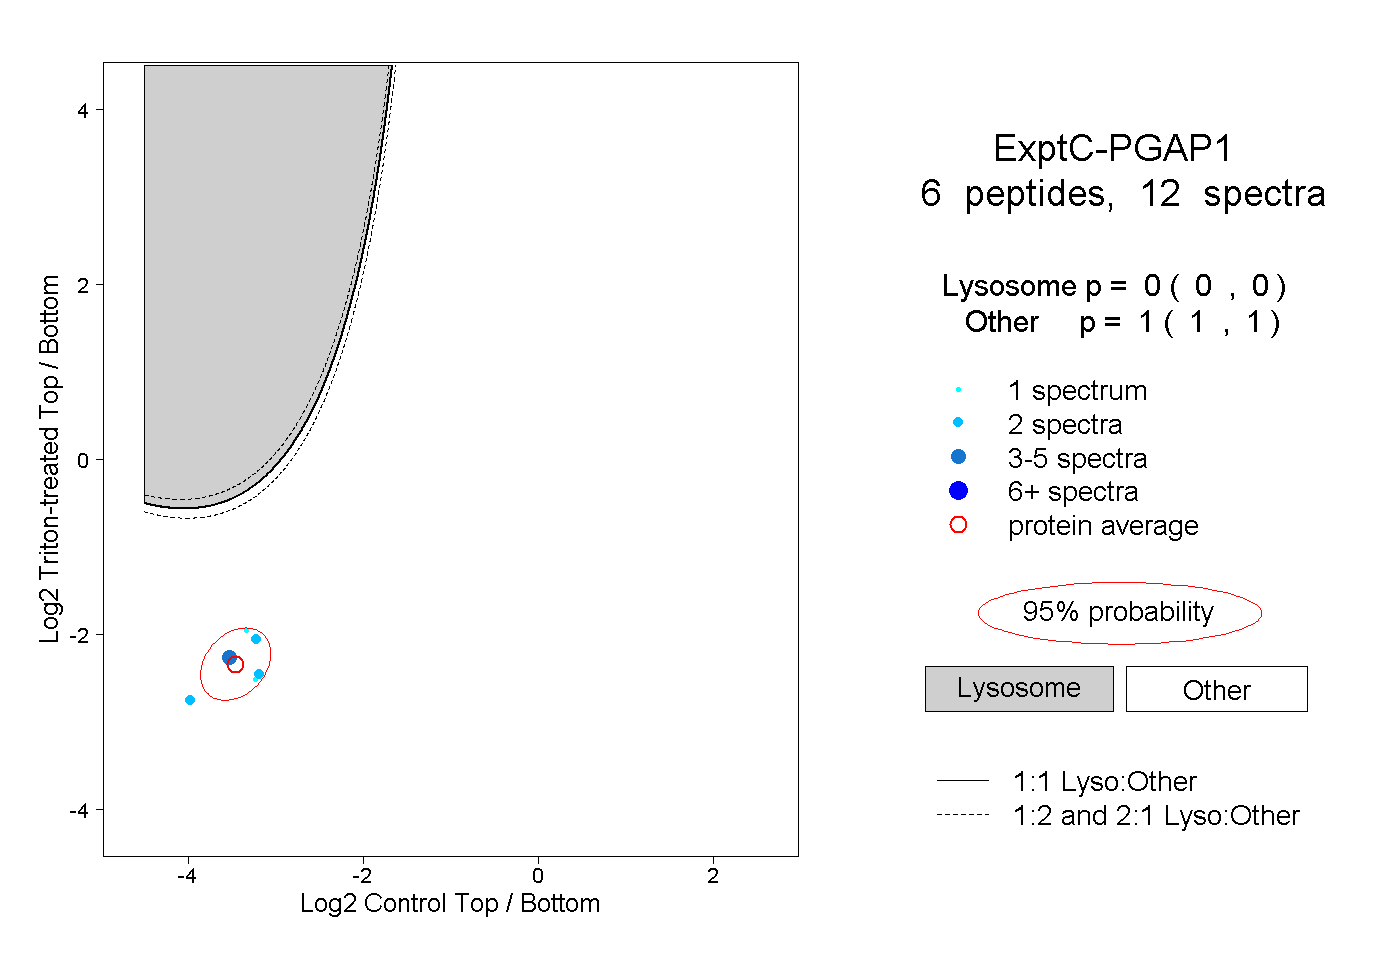 |
0.000 0.000 | 0.000 |
1.000 1.000 | 1.000 |