 6
6peptides
spectra
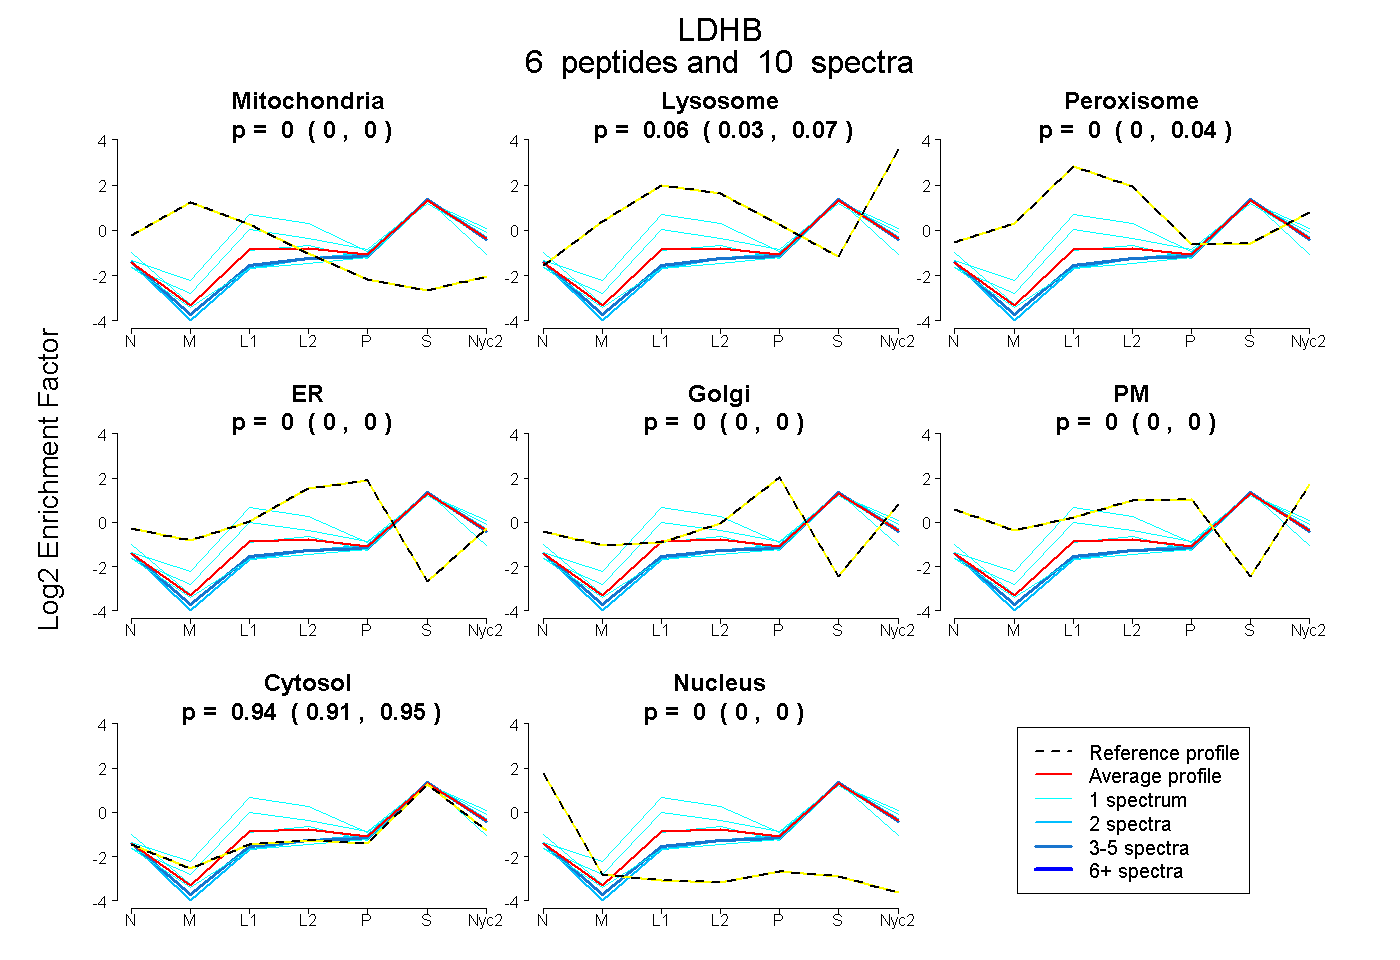
0.000 | 0.000
0.033 | 0.073
0.000 | 0.042
0.000 | 0.002
0.000 | 0.000
0.000 | 0.000
0.907 | 0.953
0.000 | 0.000
2peptides
spectra
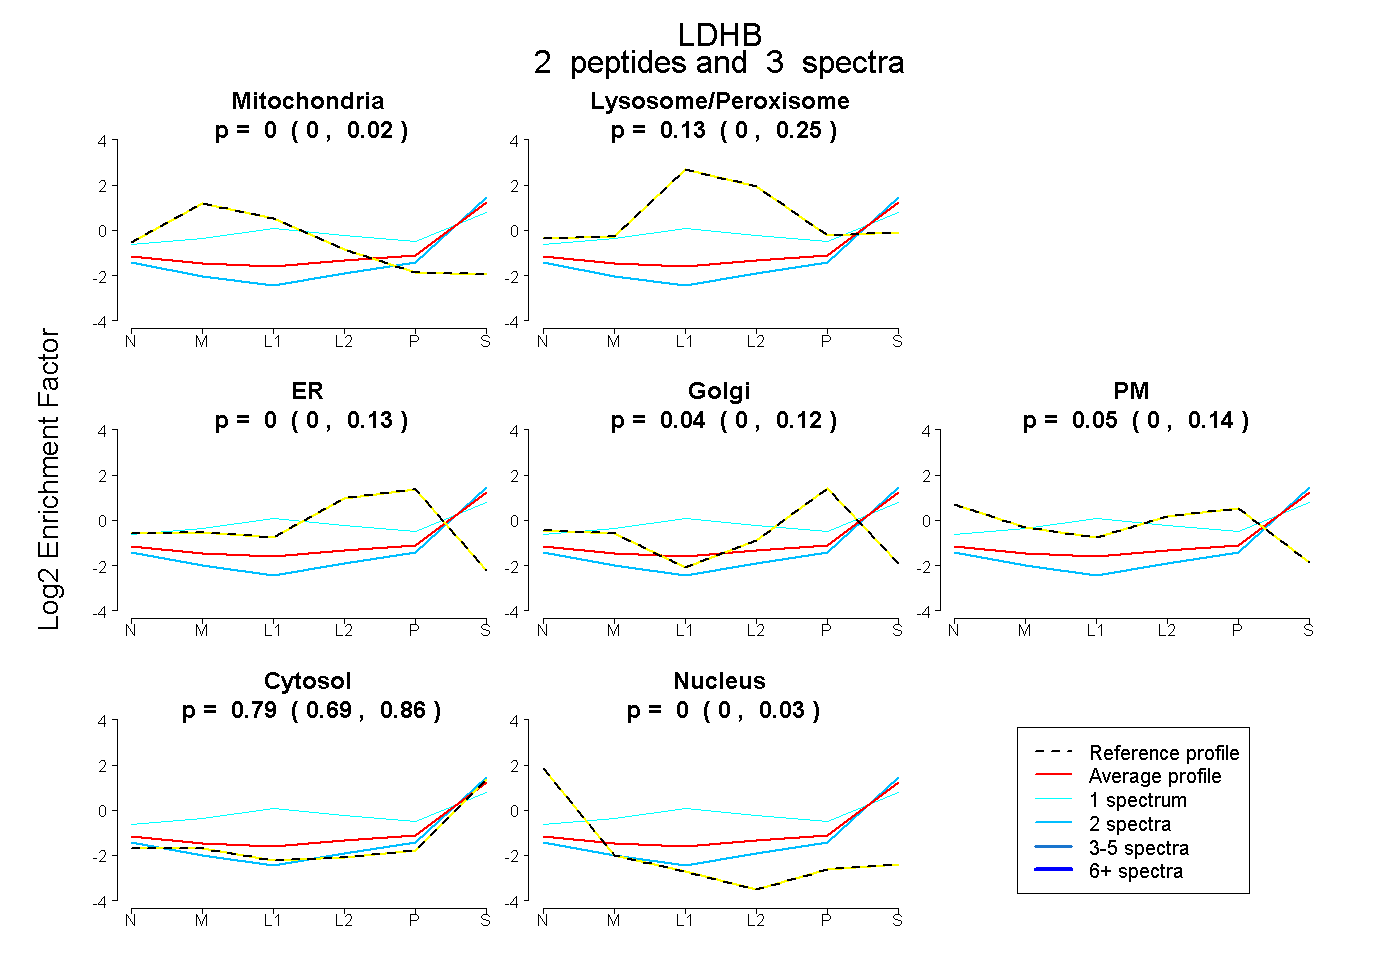
0.000 | 0.016
0.000 | 0.252
0.000 | 0.133
0.000 | 0.125
0.000 | 0.140
0.695 | 0.855
0.000 | 0.031
5peptides
spectra
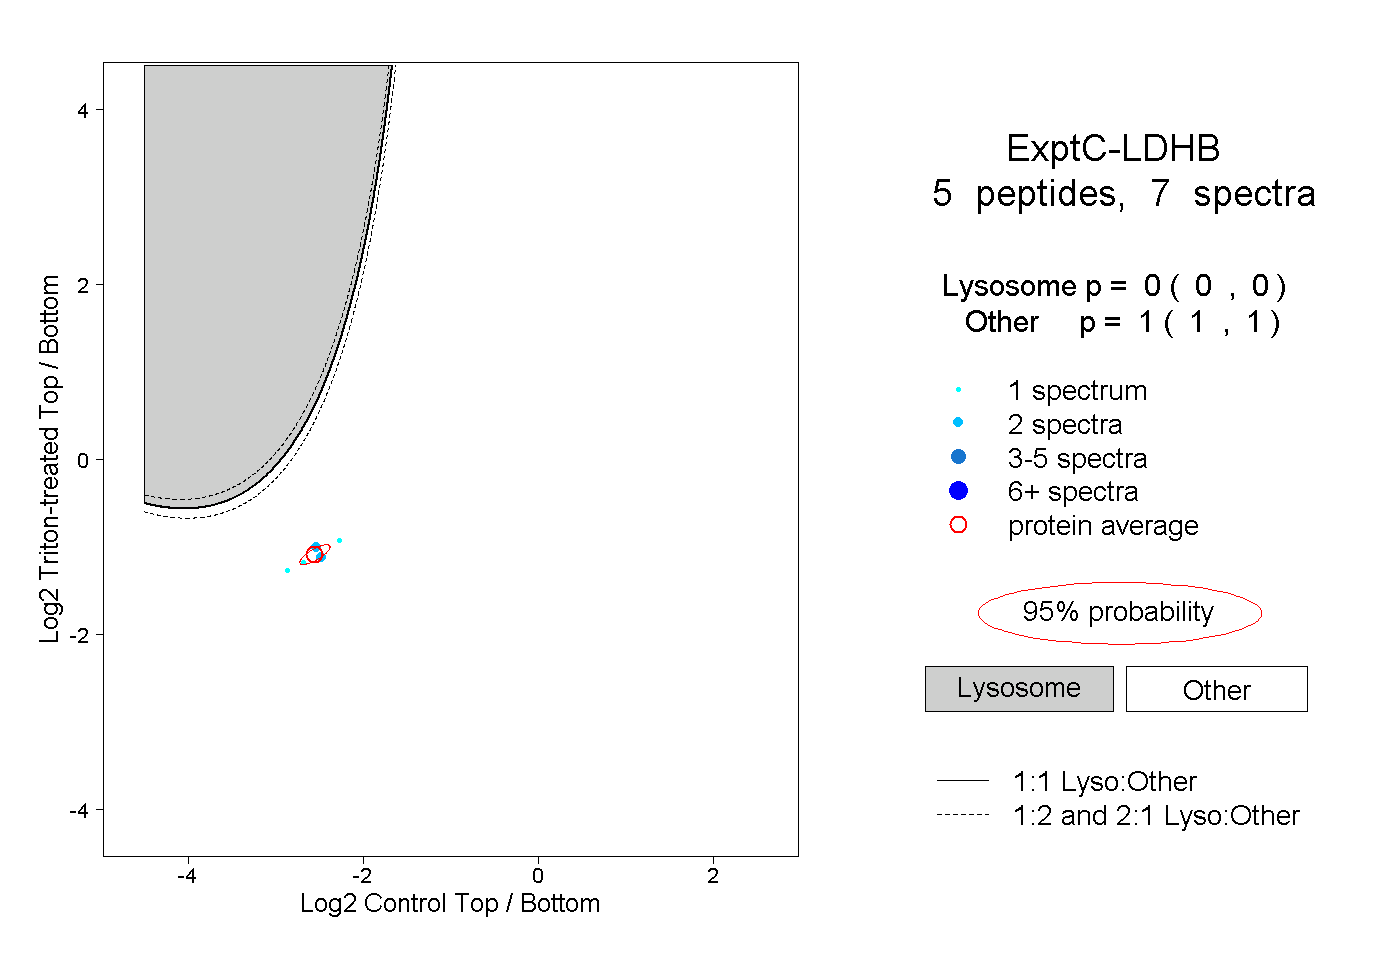
0.000 | 0.000
1.000 | 1.000