 6
6peptides
spectra
0.000 | 0.000
0.033 | 0.073
0.000 | 0.042
0.000 | 0.002
0.000 | 0.000
0.000 | 0.000
0.907 | 0.953
0.000 | 0.000
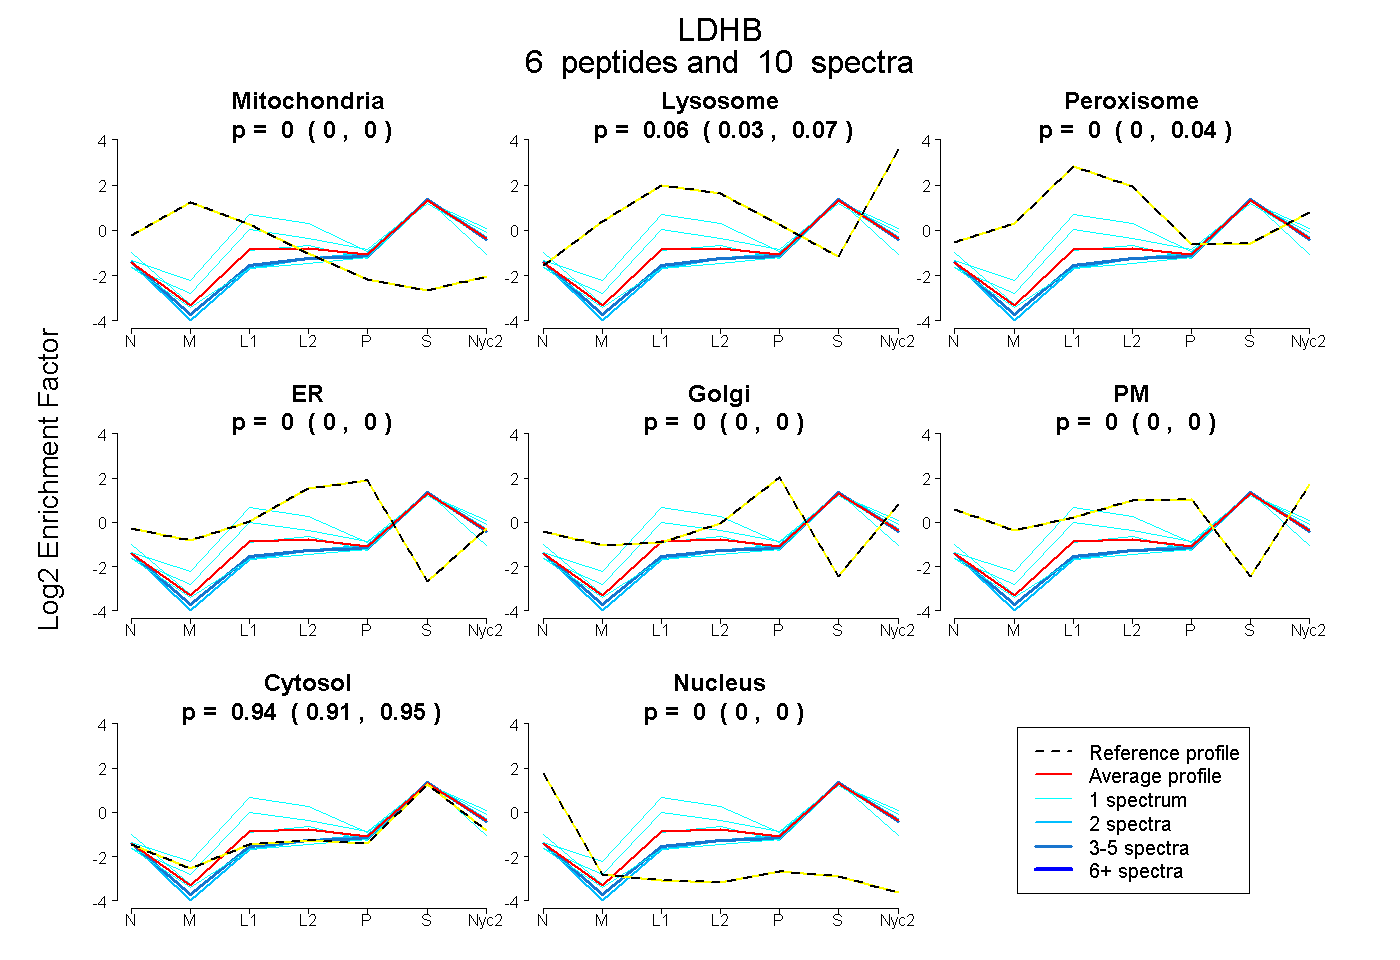
| Plot | Mito | Lyso | Perox | ER | Golgi | PM | Cytosol | Nucleus | |||||
| Expt A |
6 peptides |
10 spectra |
|
0.000 0.000 | 0.000 |
0.065 0.033 | 0.073 |
0.000 0.000 | 0.042 |
0.000 0.000 | 0.002 |
0.000 0.000 | 0.000 |
0.000 0.000 | 0.000 |
0.935 0.907 | 0.953 |
0.000 0.000 | 0.000 |
| 4 spectra, IVVVTAGVR | 0.000 | 0.000 | 0.000 | 0.000 | 0.000 | 0.000 | 1.000 | 0.000 | ||
| 1 spectrum, LSGLPK | 0.000 | 0.000 | 0.372 | 0.000 | 0.000 | 0.000 | 0.628 | 0.000 | ||
| 2 spectra, FIIPQIVK | 0.000 | 0.000 | 0.000 | 0.000 | 0.000 | 0.000 | 1.000 | 0.000 | ||
| 1 spectrum, MVVDSAYEVIK | 0.000 | 0.000 | 0.000 | 0.000 | 0.000 | 0.000 | 0.994 | 0.006 | ||
| 1 spectrum, GLTSVINQK | 0.000 | 0.102 | 0.000 | 0.000 | 0.000 | 0.000 | 0.898 | 0.000 | ||
| 1 spectrum, SADTLWDIQK | 0.000 | 0.092 | 0.131 | 0.000 | 0.000 | 0.000 | 0.777 | 0.000 |
| Plot | Mito | Lyso or Perox | ER | Golgi | PM | Cytosol | Nucleus | ||||||
| Expt B |
2 peptides |
3 spectra |
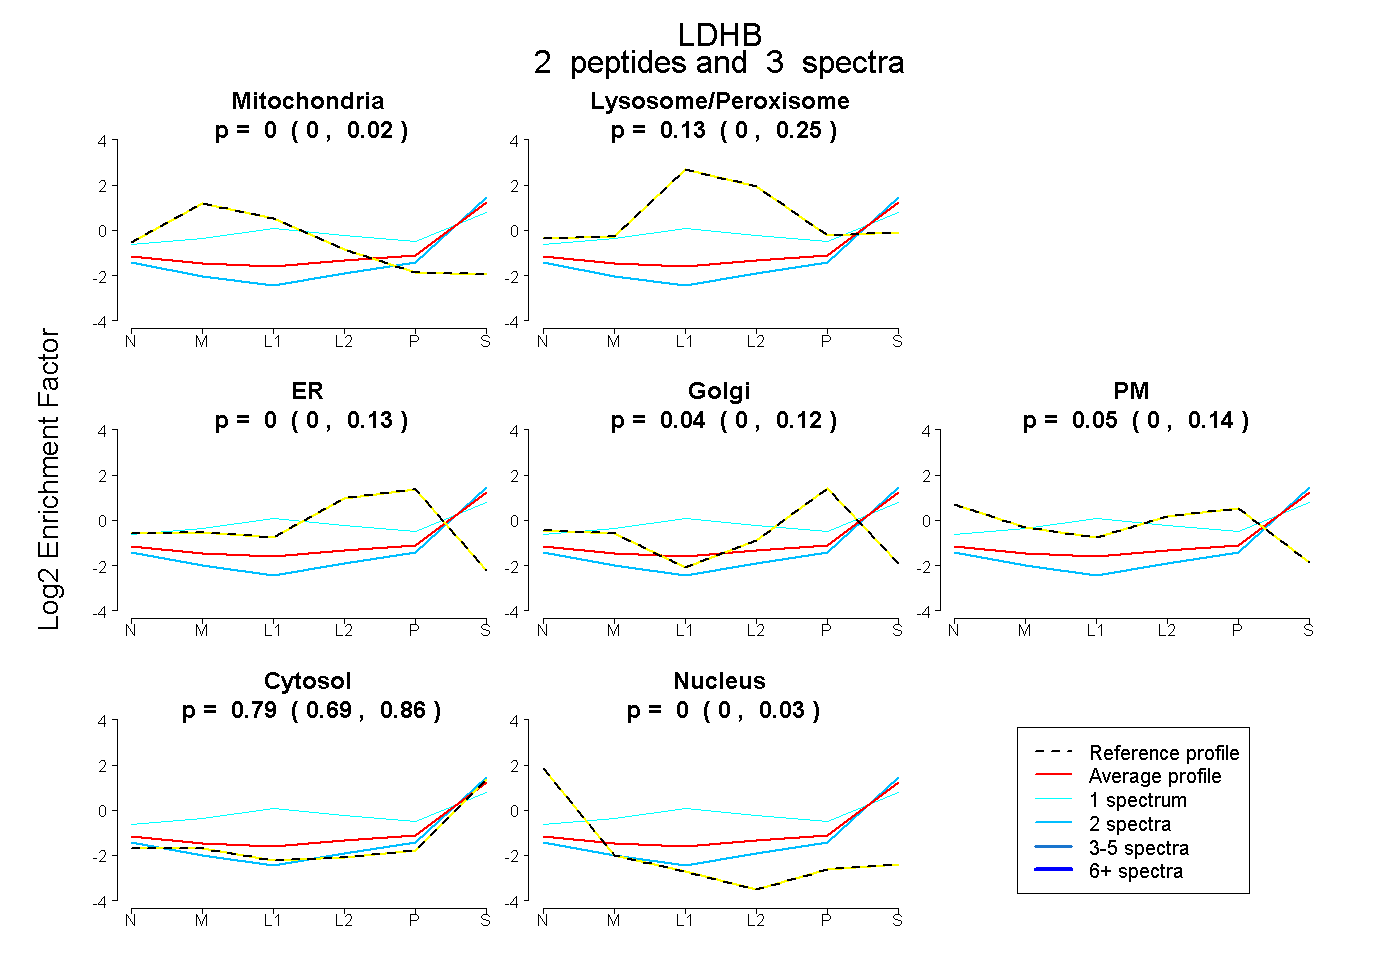 |
0.000 0.000 | 0.016 |
0.128 0.000 | 0.252 |
0.000 0.000 | 0.133 |
0.038 0.000 | 0.125 |
0.046 0.000 | 0.140 |
0.788 0.695 | 0.855 |
0.000 0.000 | 0.031 |
|||
| Plot | Lyso | Other | |||||||||||
| Expt C |
5 peptides |
7 spectra |
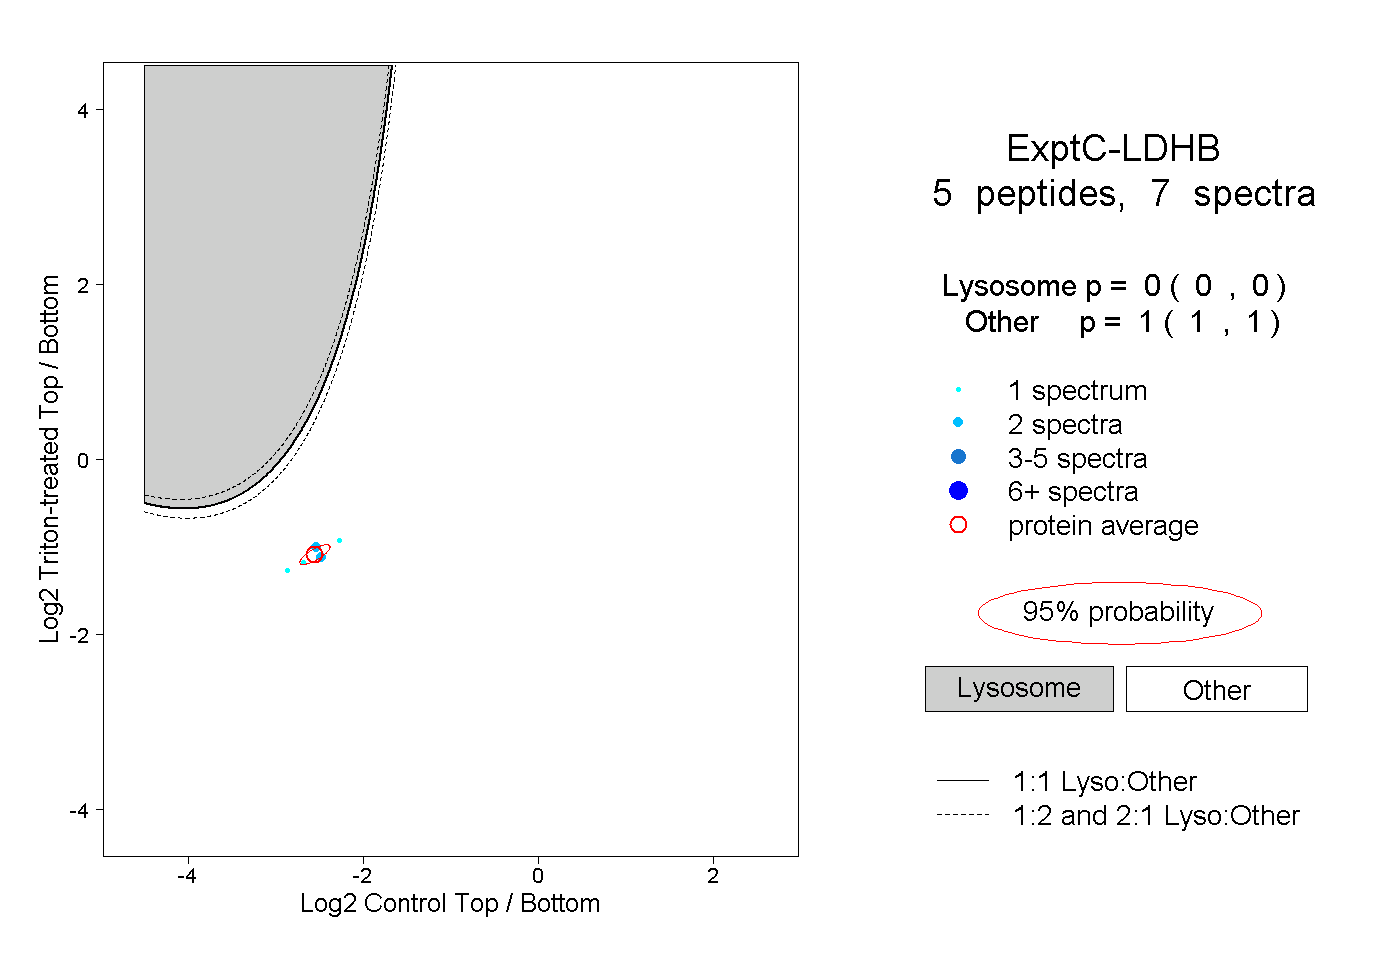 |
0.000 0.000 | 0.000 |
1.000 1.000 | 1.000 |