 15
15peptides
spectra
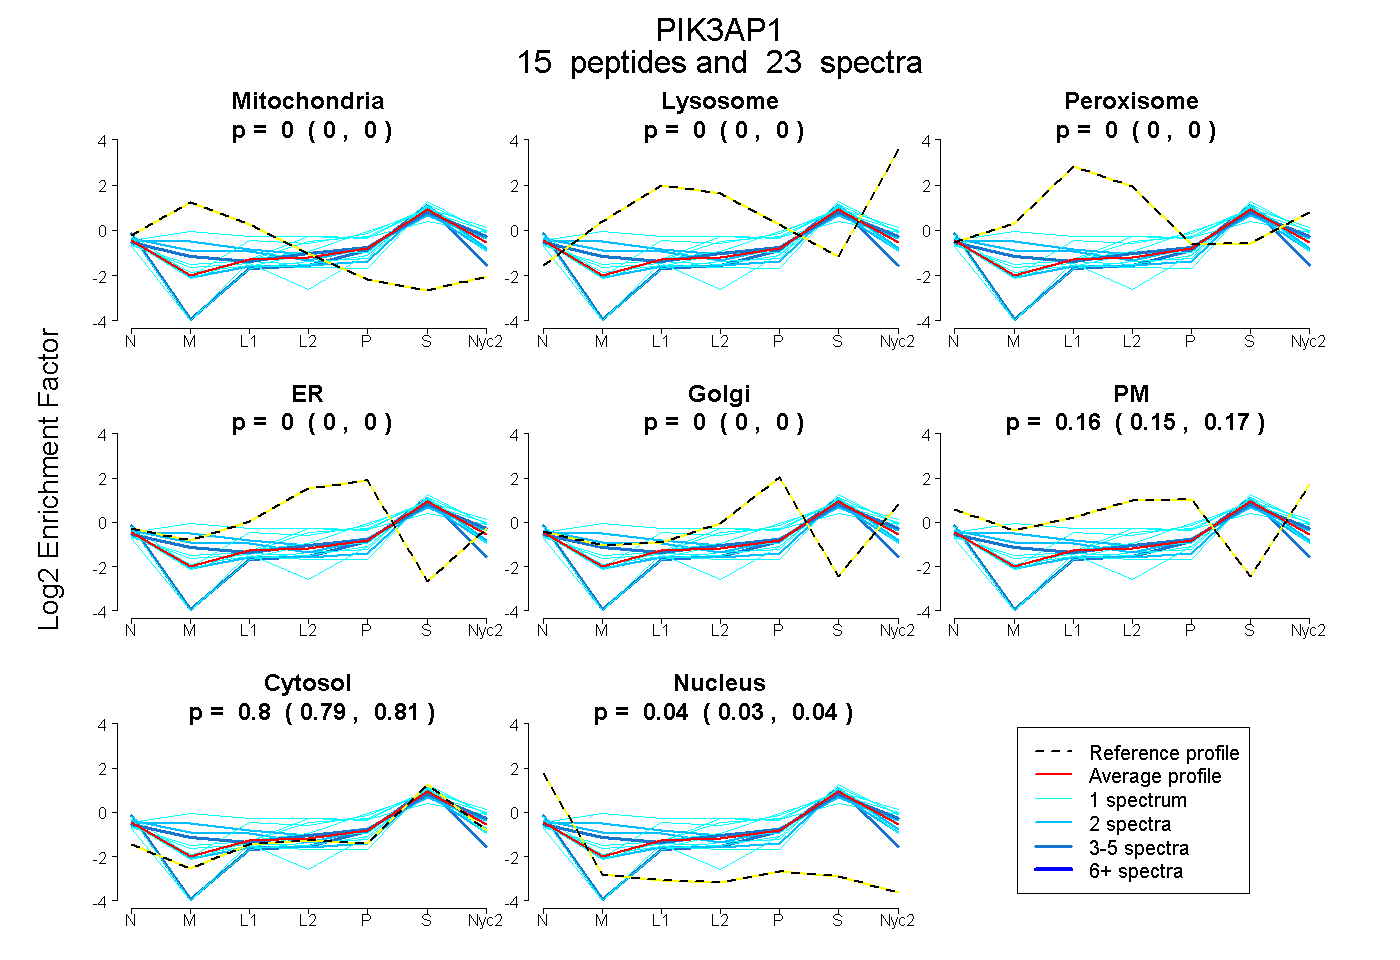
0.000 | 0.000
0.000 | 0.000
0.000 | 0.000
0.000 | 0.000
0.000 | 0.000
0.152 | 0.169
0.793 | 0.806
0.032 | 0.044
3peptides
spectra
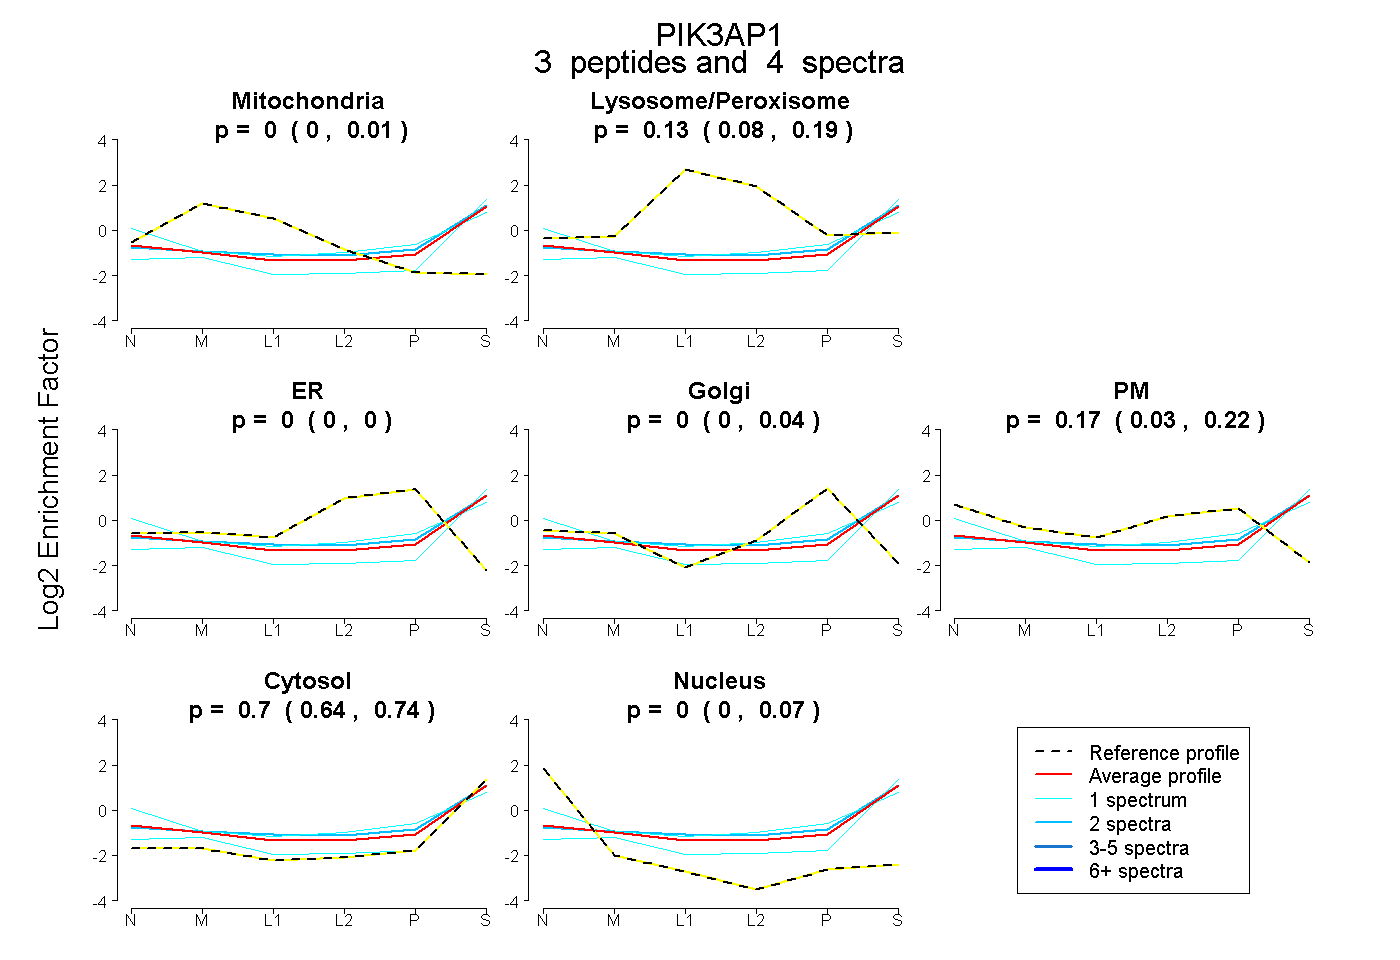
0.000 | 0.014
0.078 | 0.191
0.000 | 0.000
0.000 | 0.043
0.030 | 0.224
0.639 | 0.739
0.000 | 0.067
11peptides
spectra
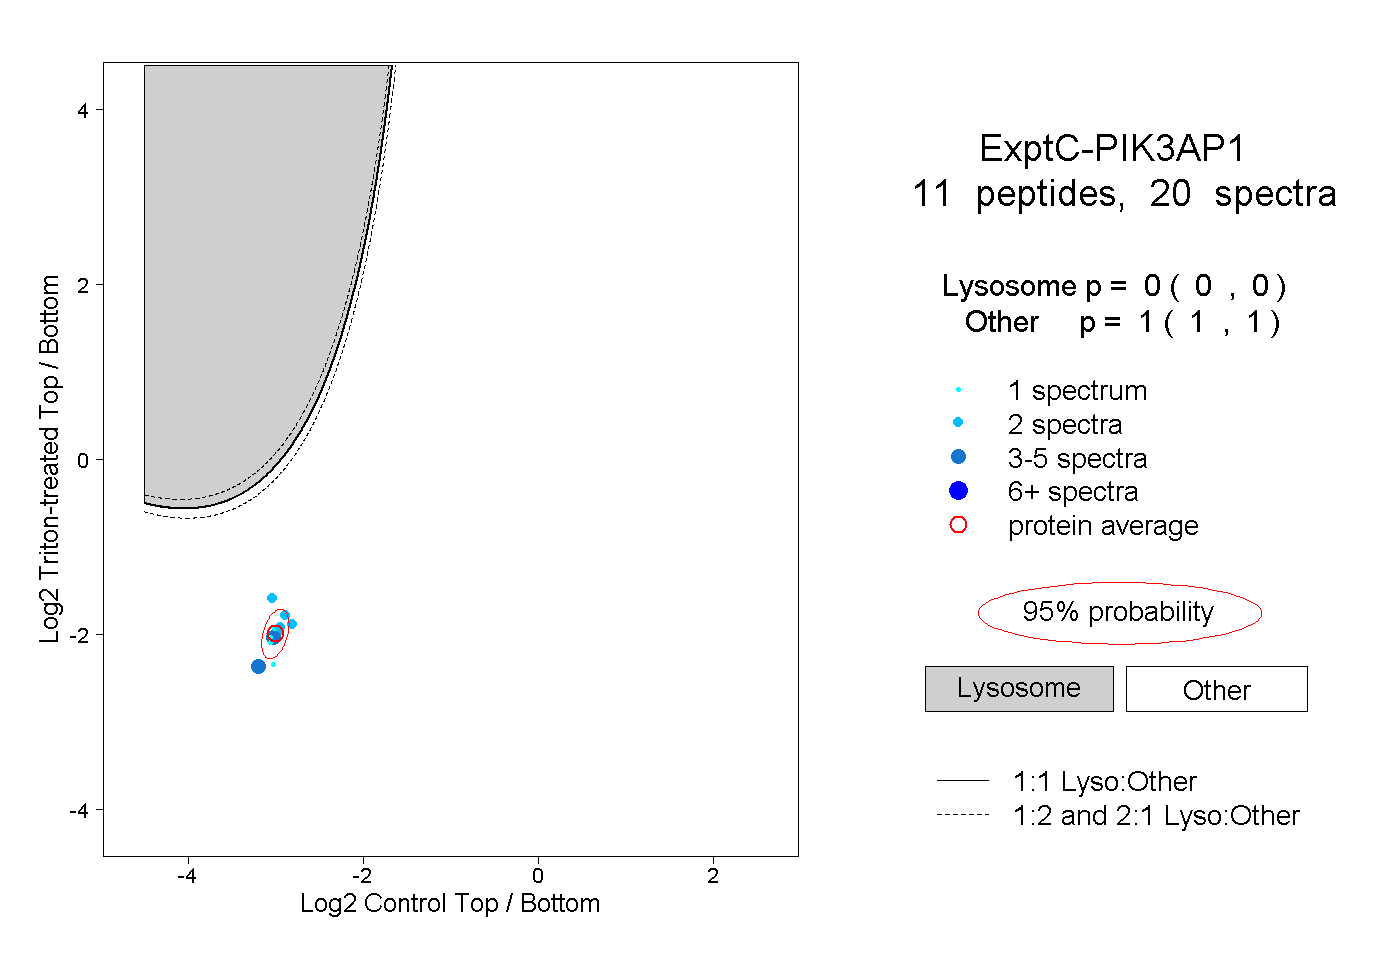
0.000 | 0.000
1.000 | 1.000